Resources
Tables and Figures
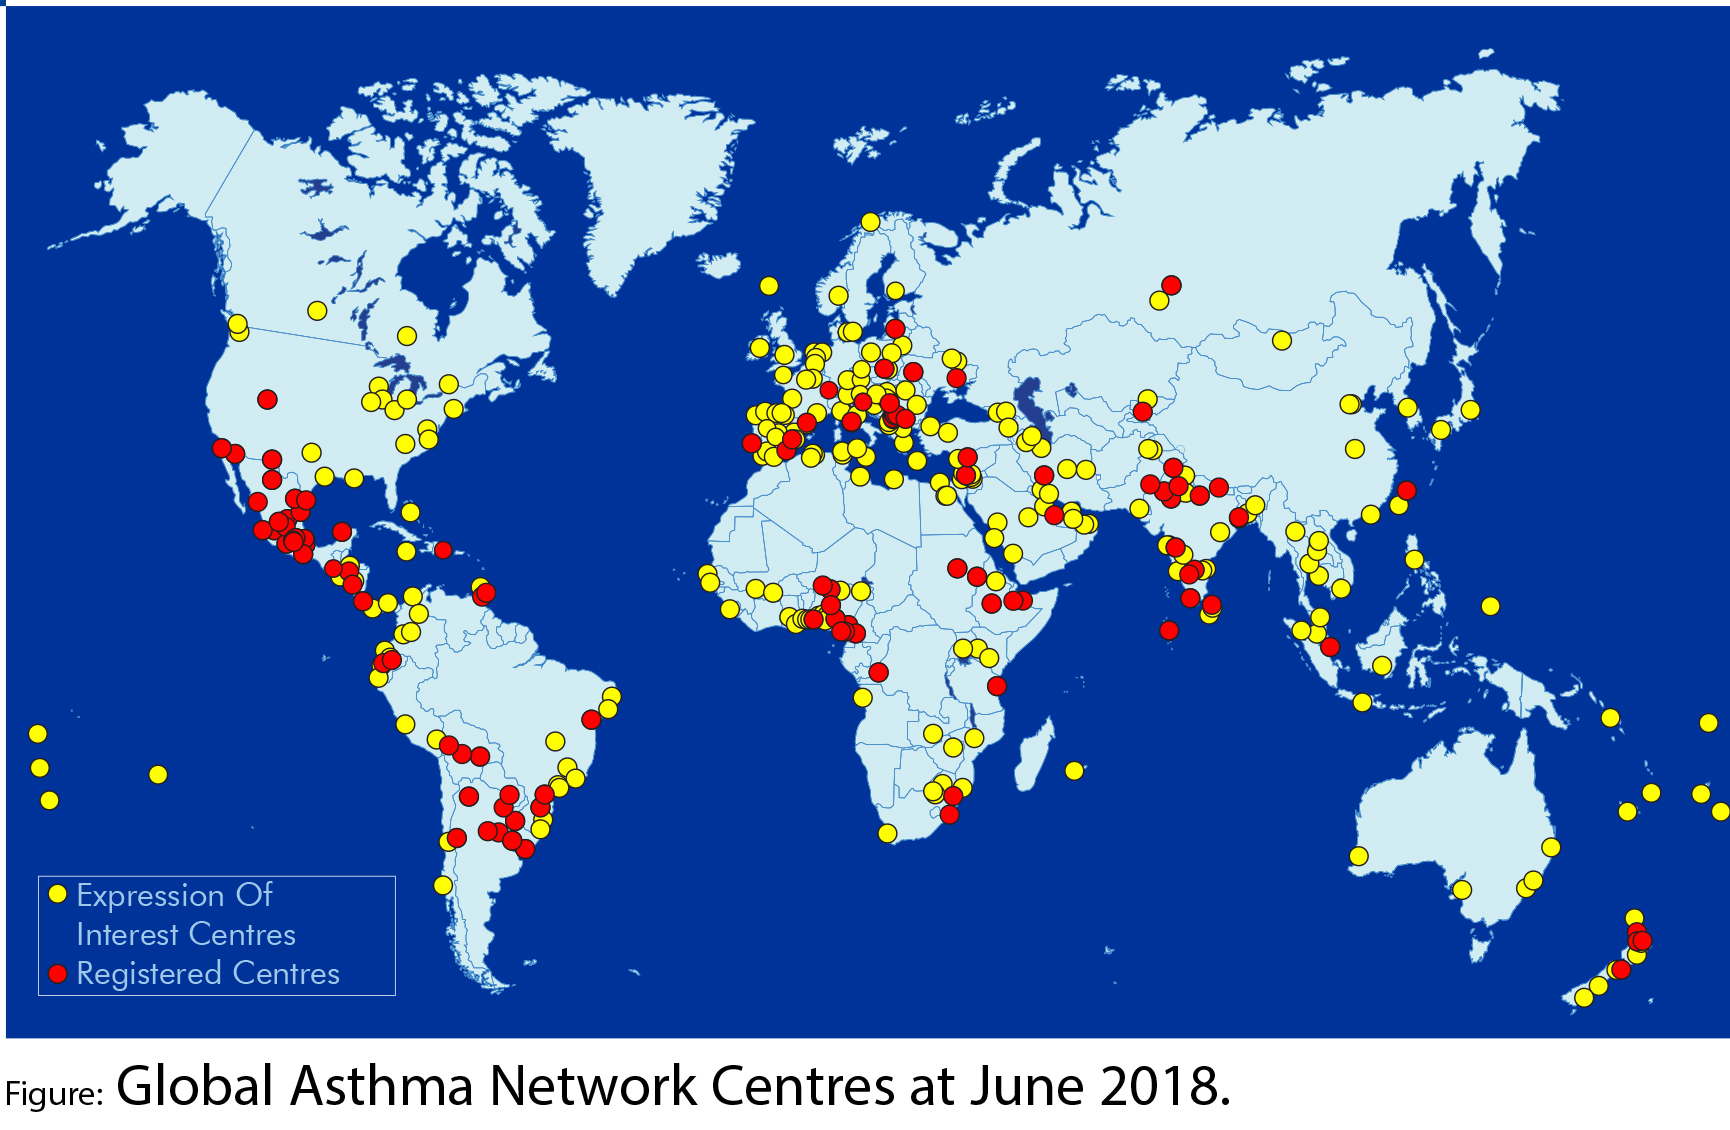
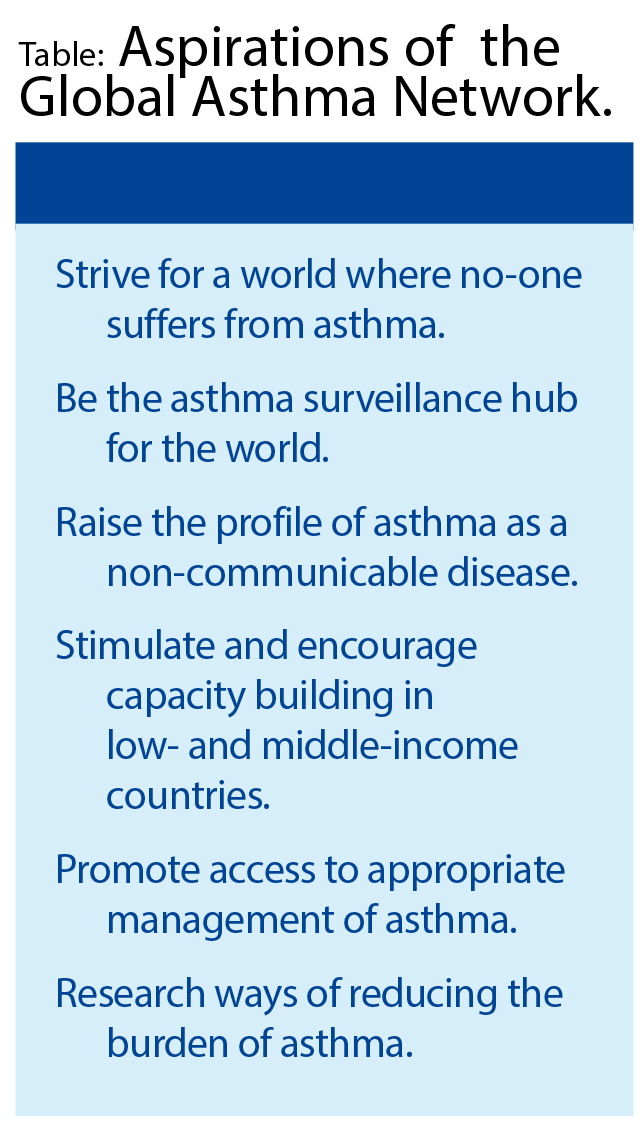
1. Global Asthma Network
Figure. Global Asthma Network Centres at June 2018
Table. Aspirations of the Global Asthma Network
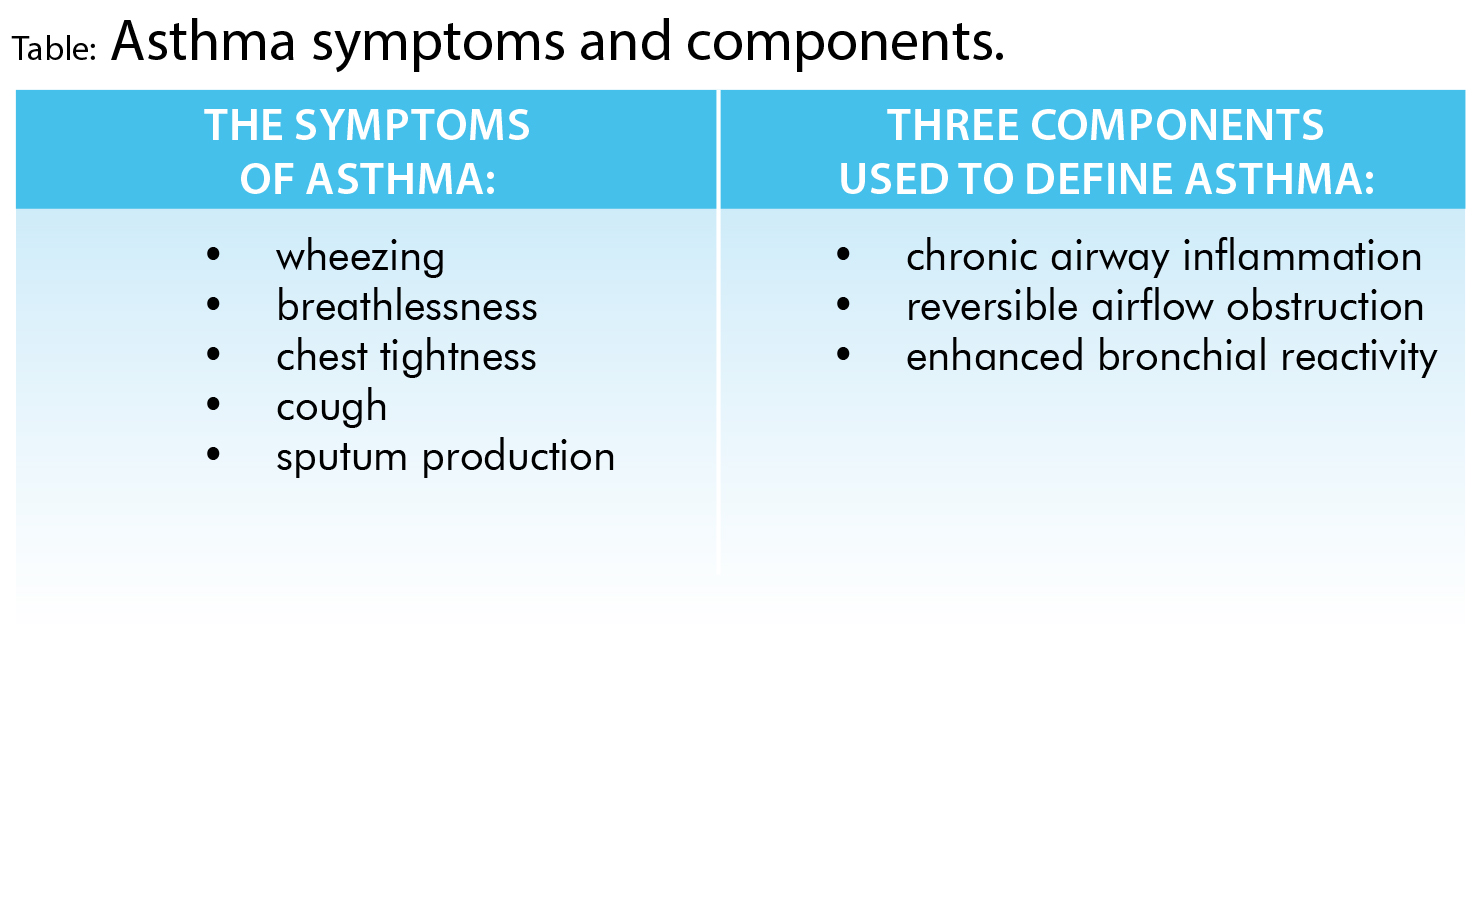
2. What is Asthma?
Table: Asthma Symptoms and components
3. Global Burden of Disease due to Asthma
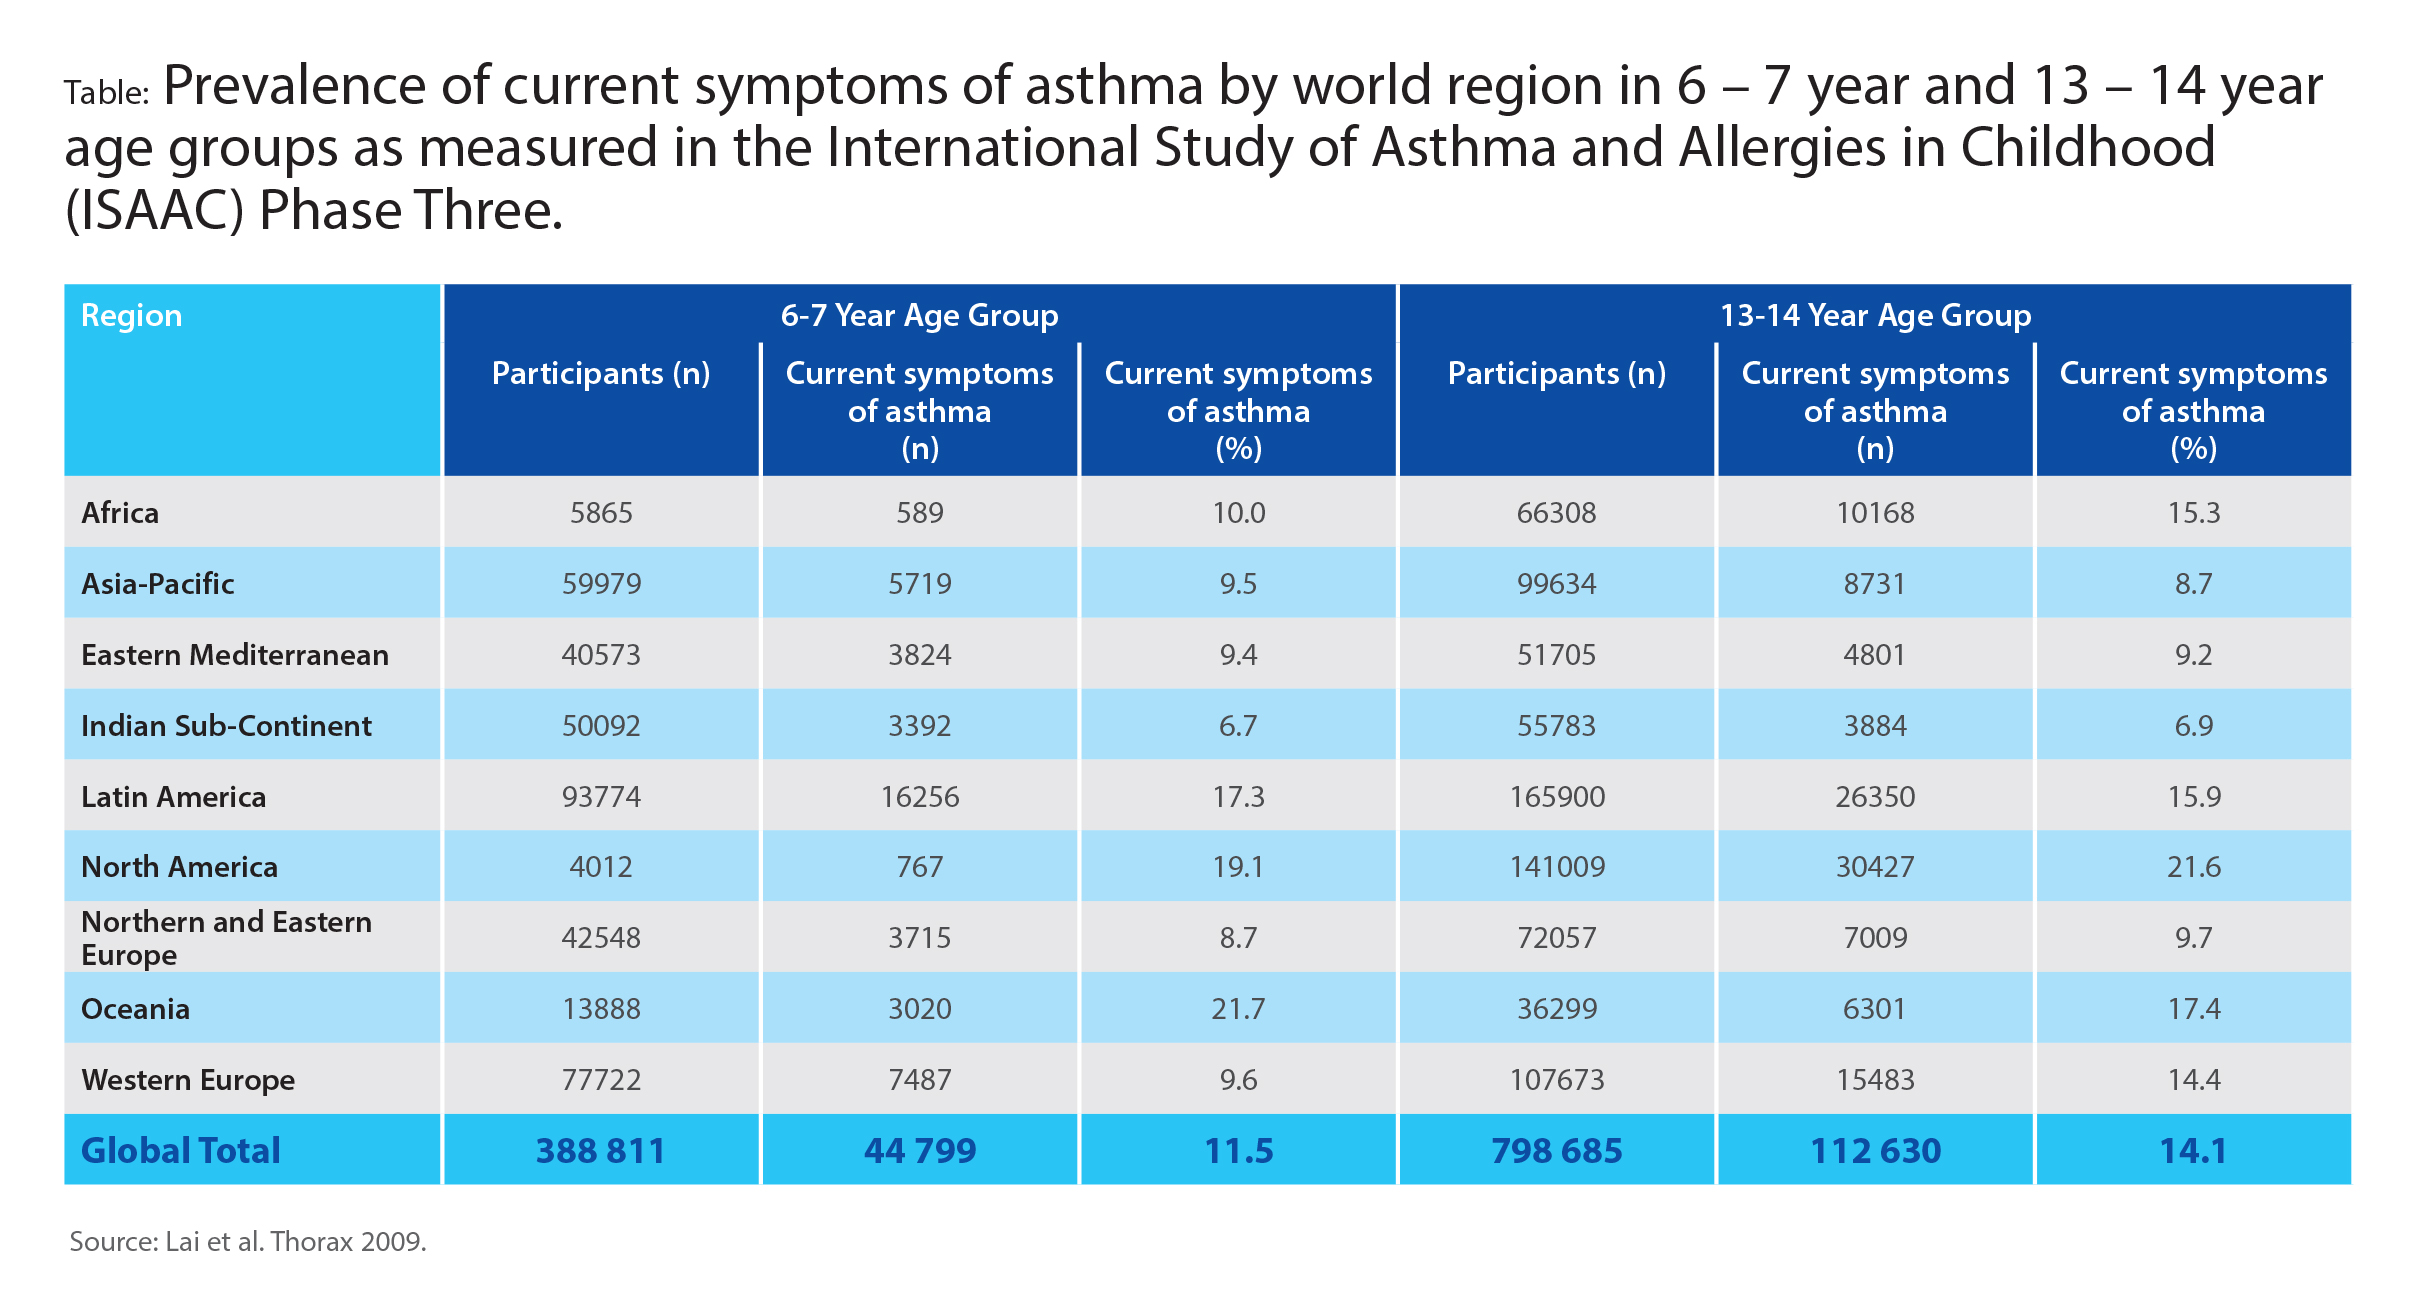
Figure 1. Prevalence of asthma symptoms among 13-14 year olds (ISAAC).
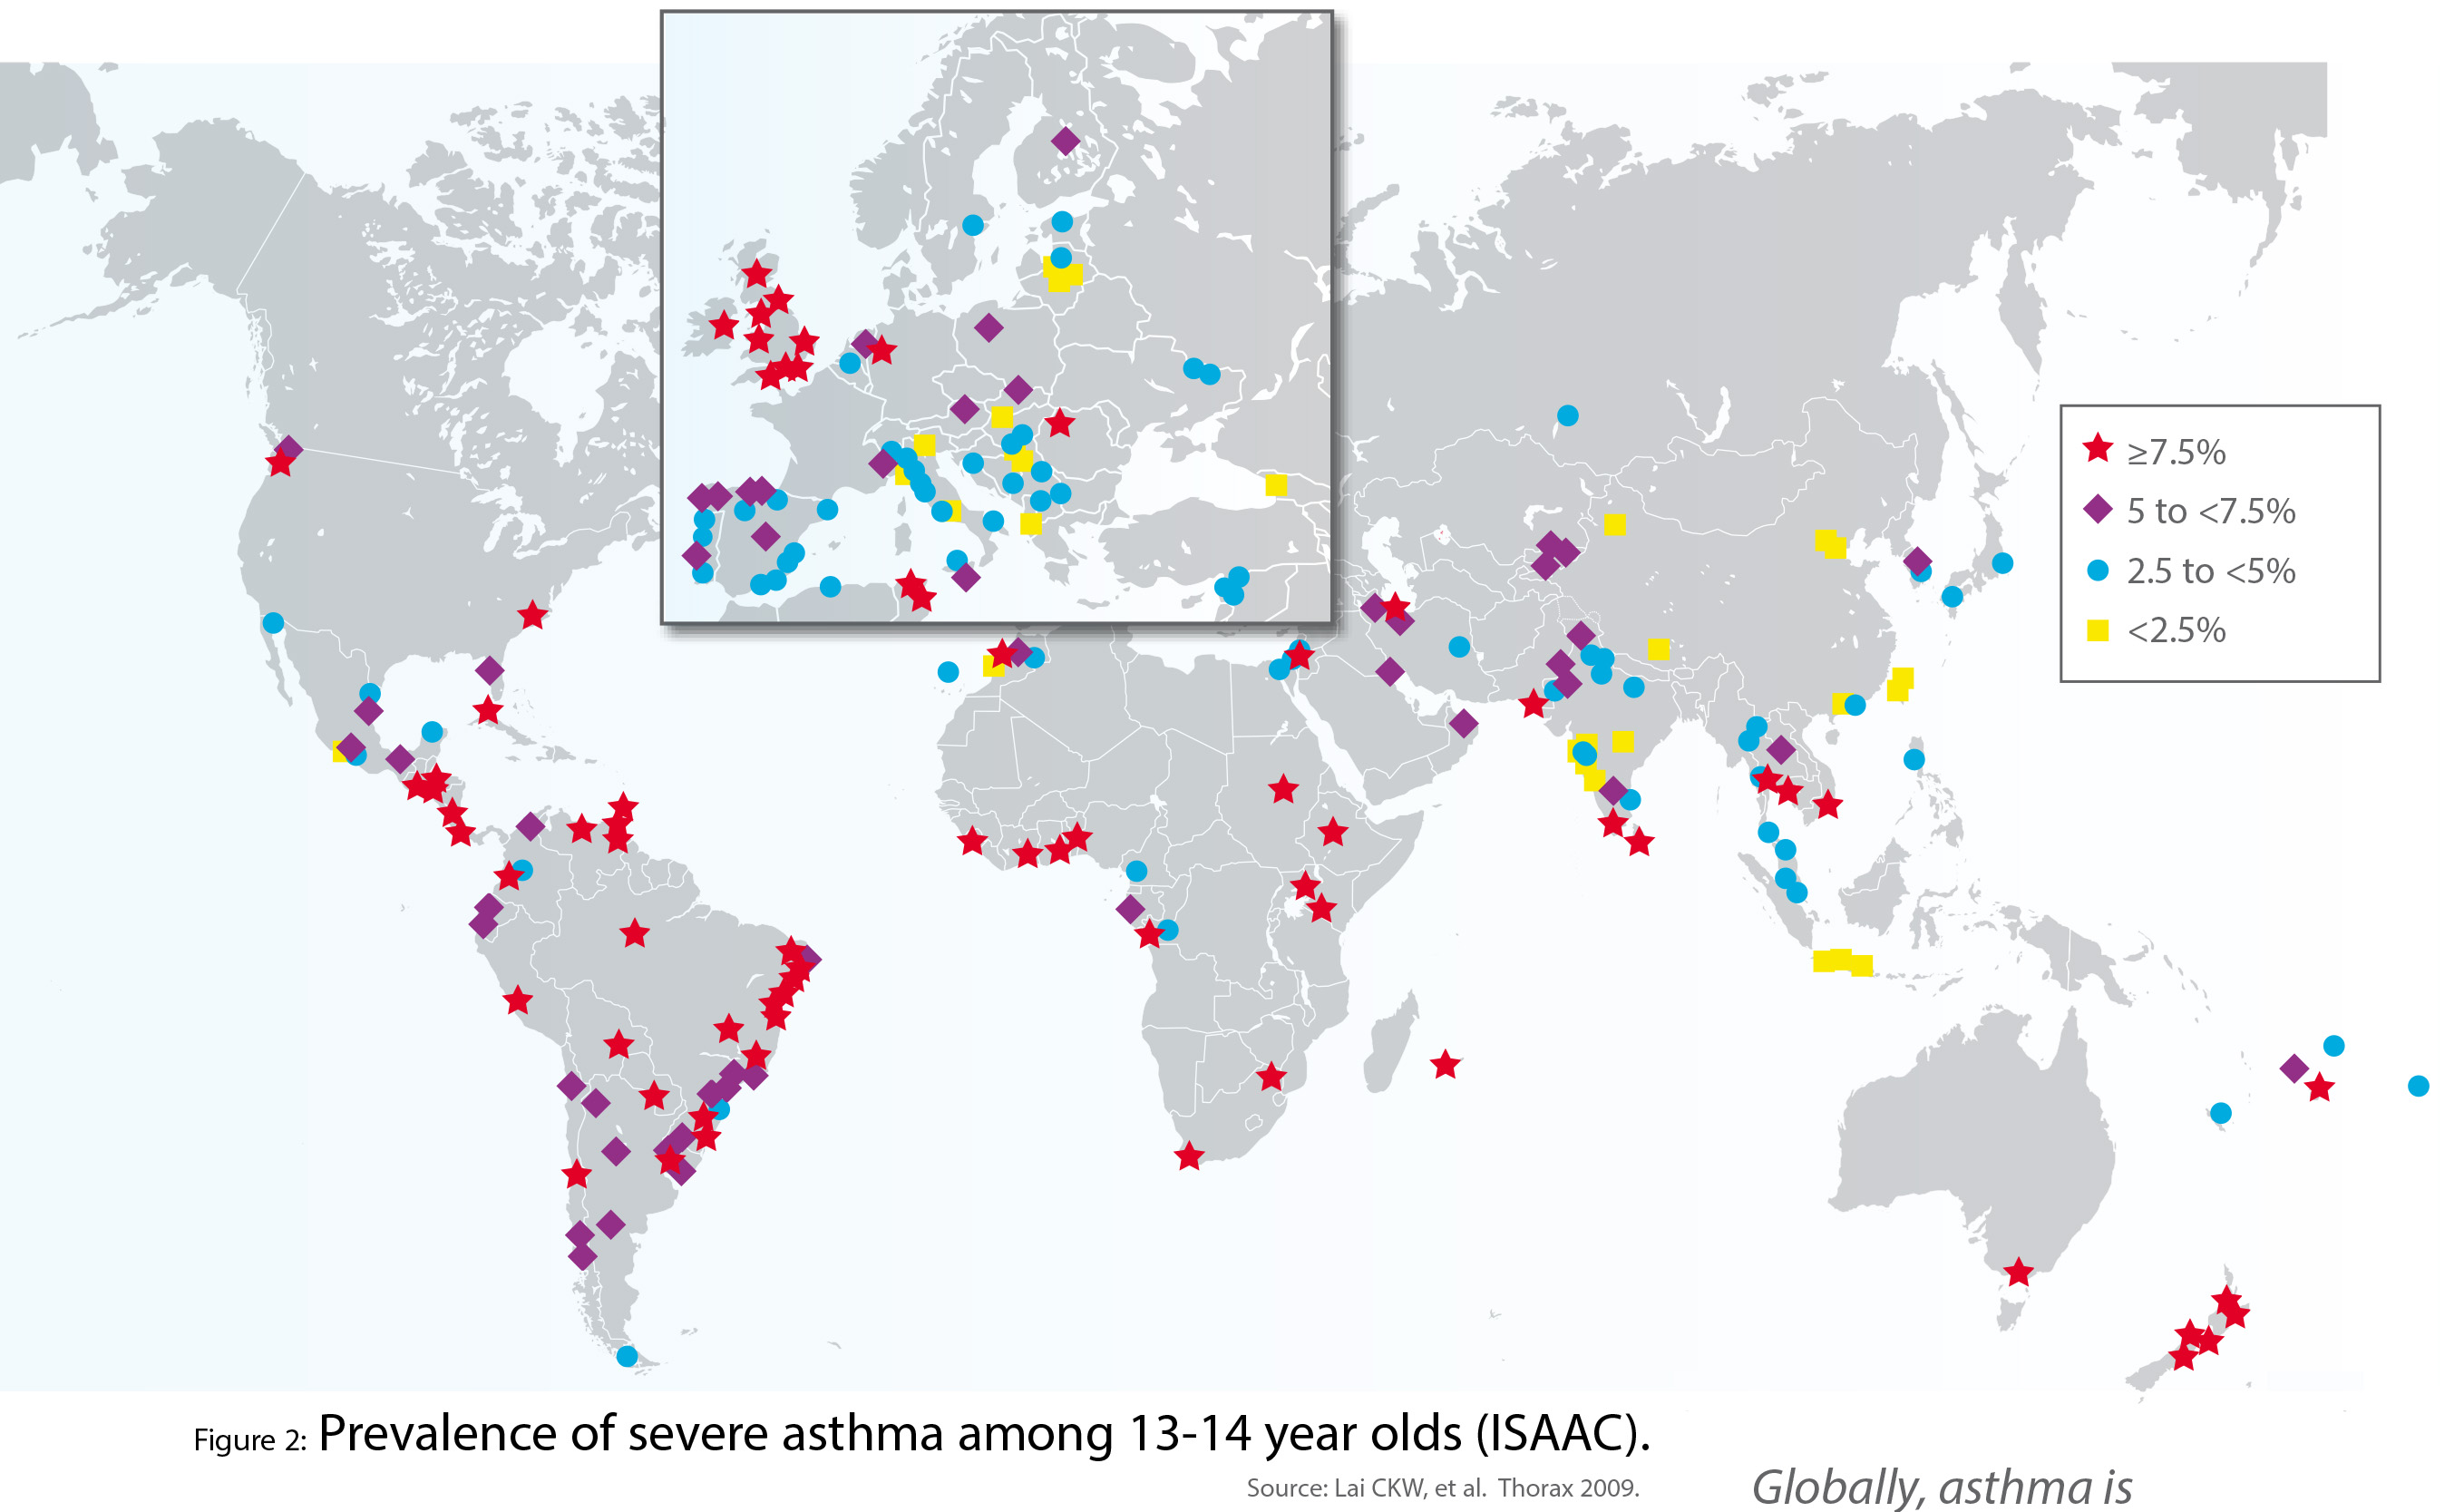
Figure 2. Prevalence of severe asthma among 13-14 year olds (ISAAC).
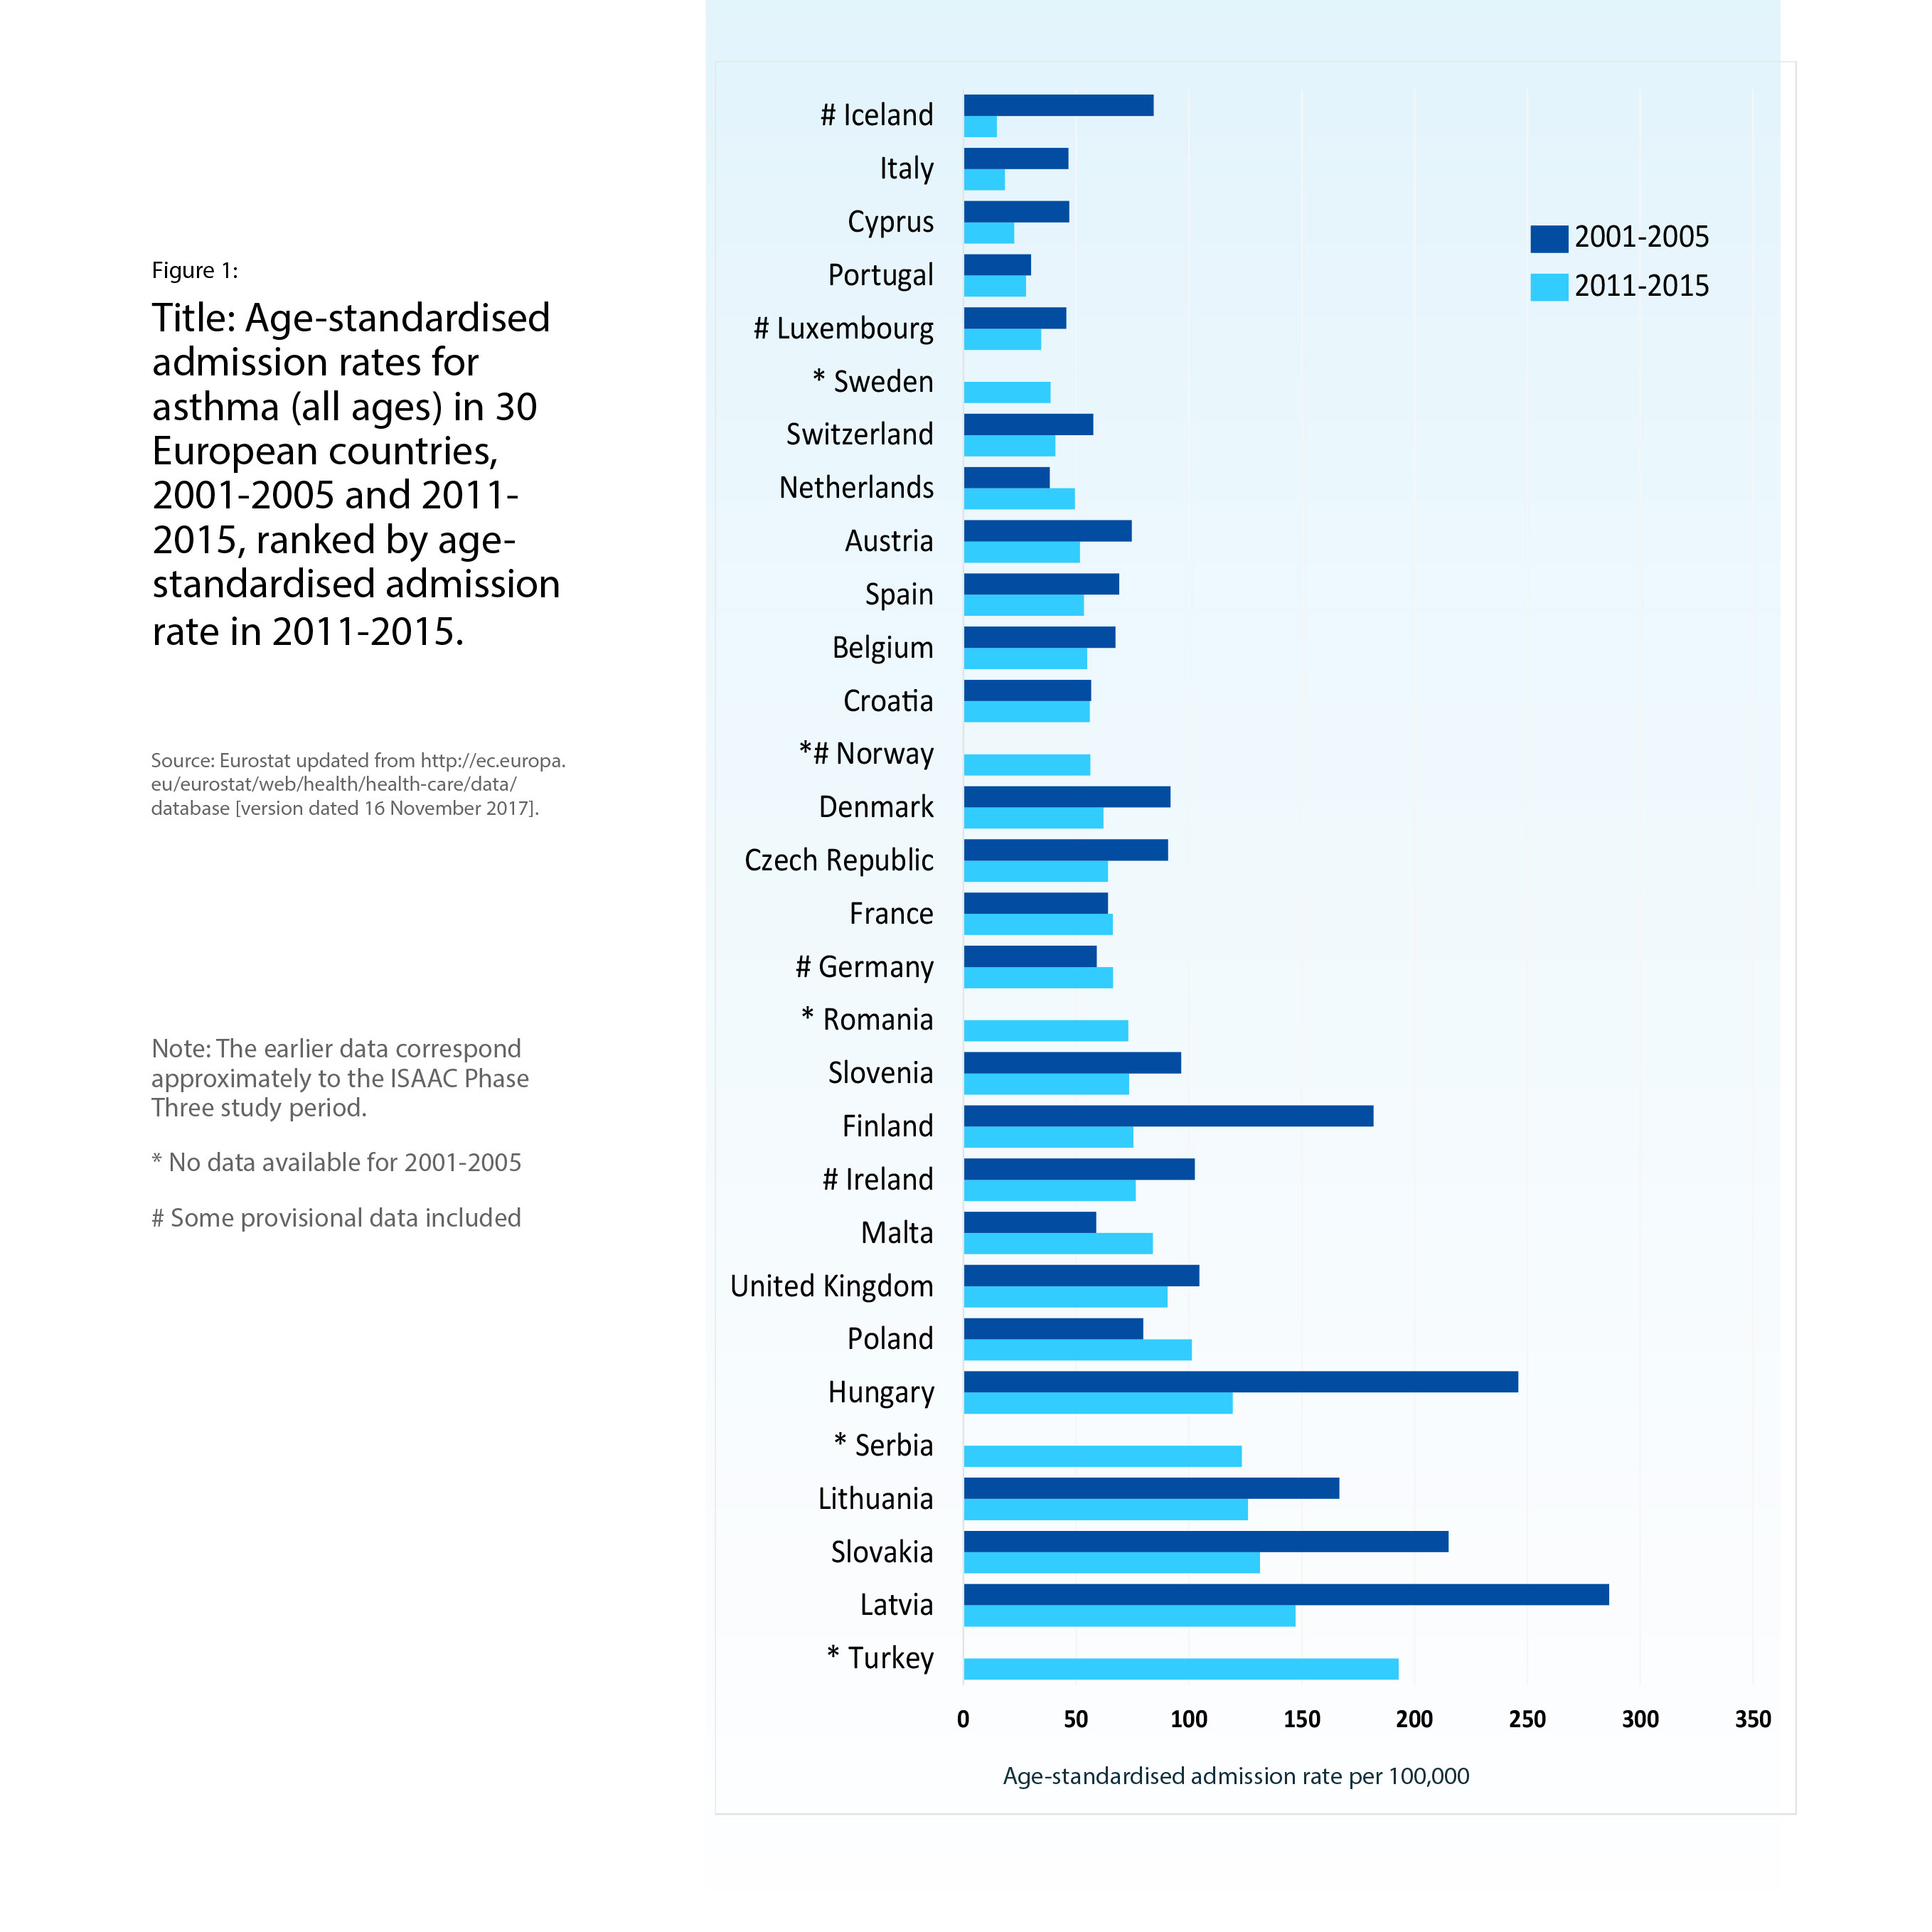
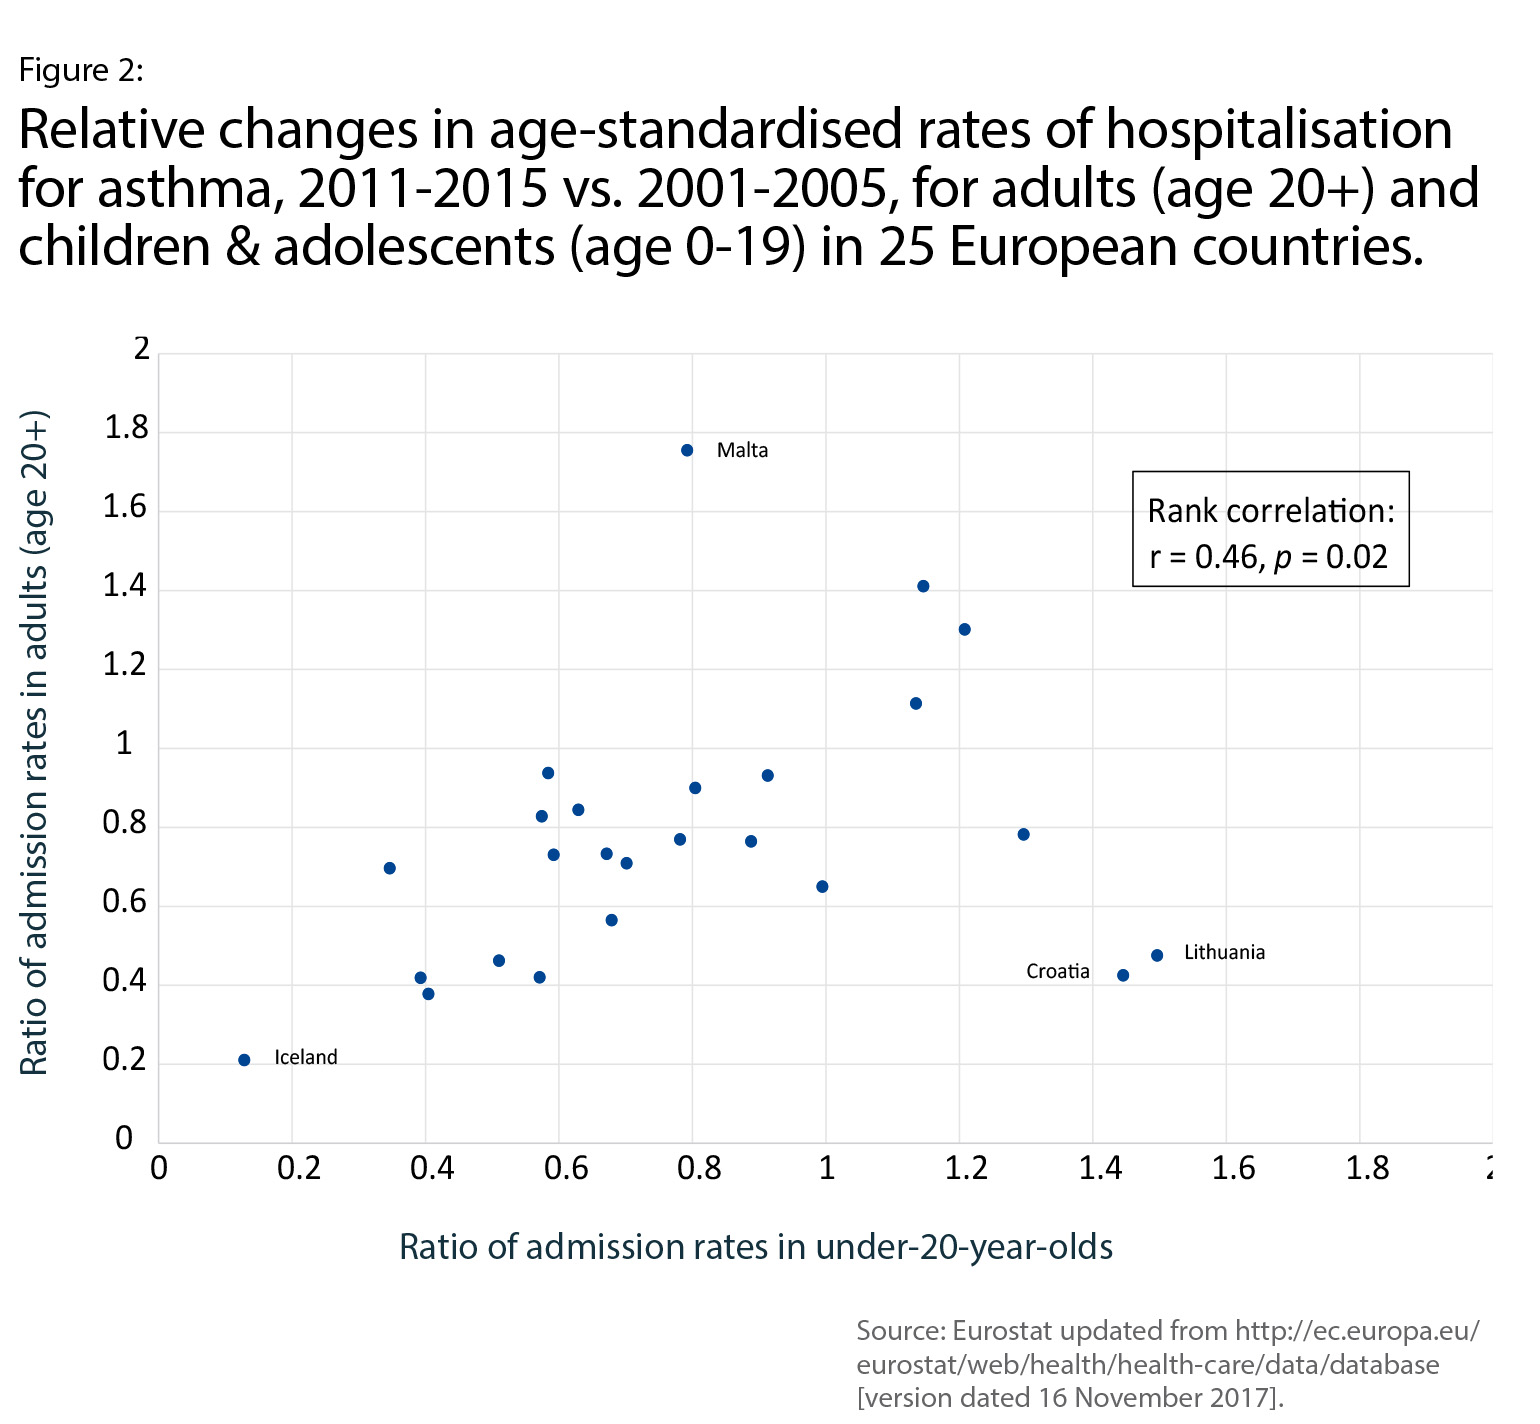
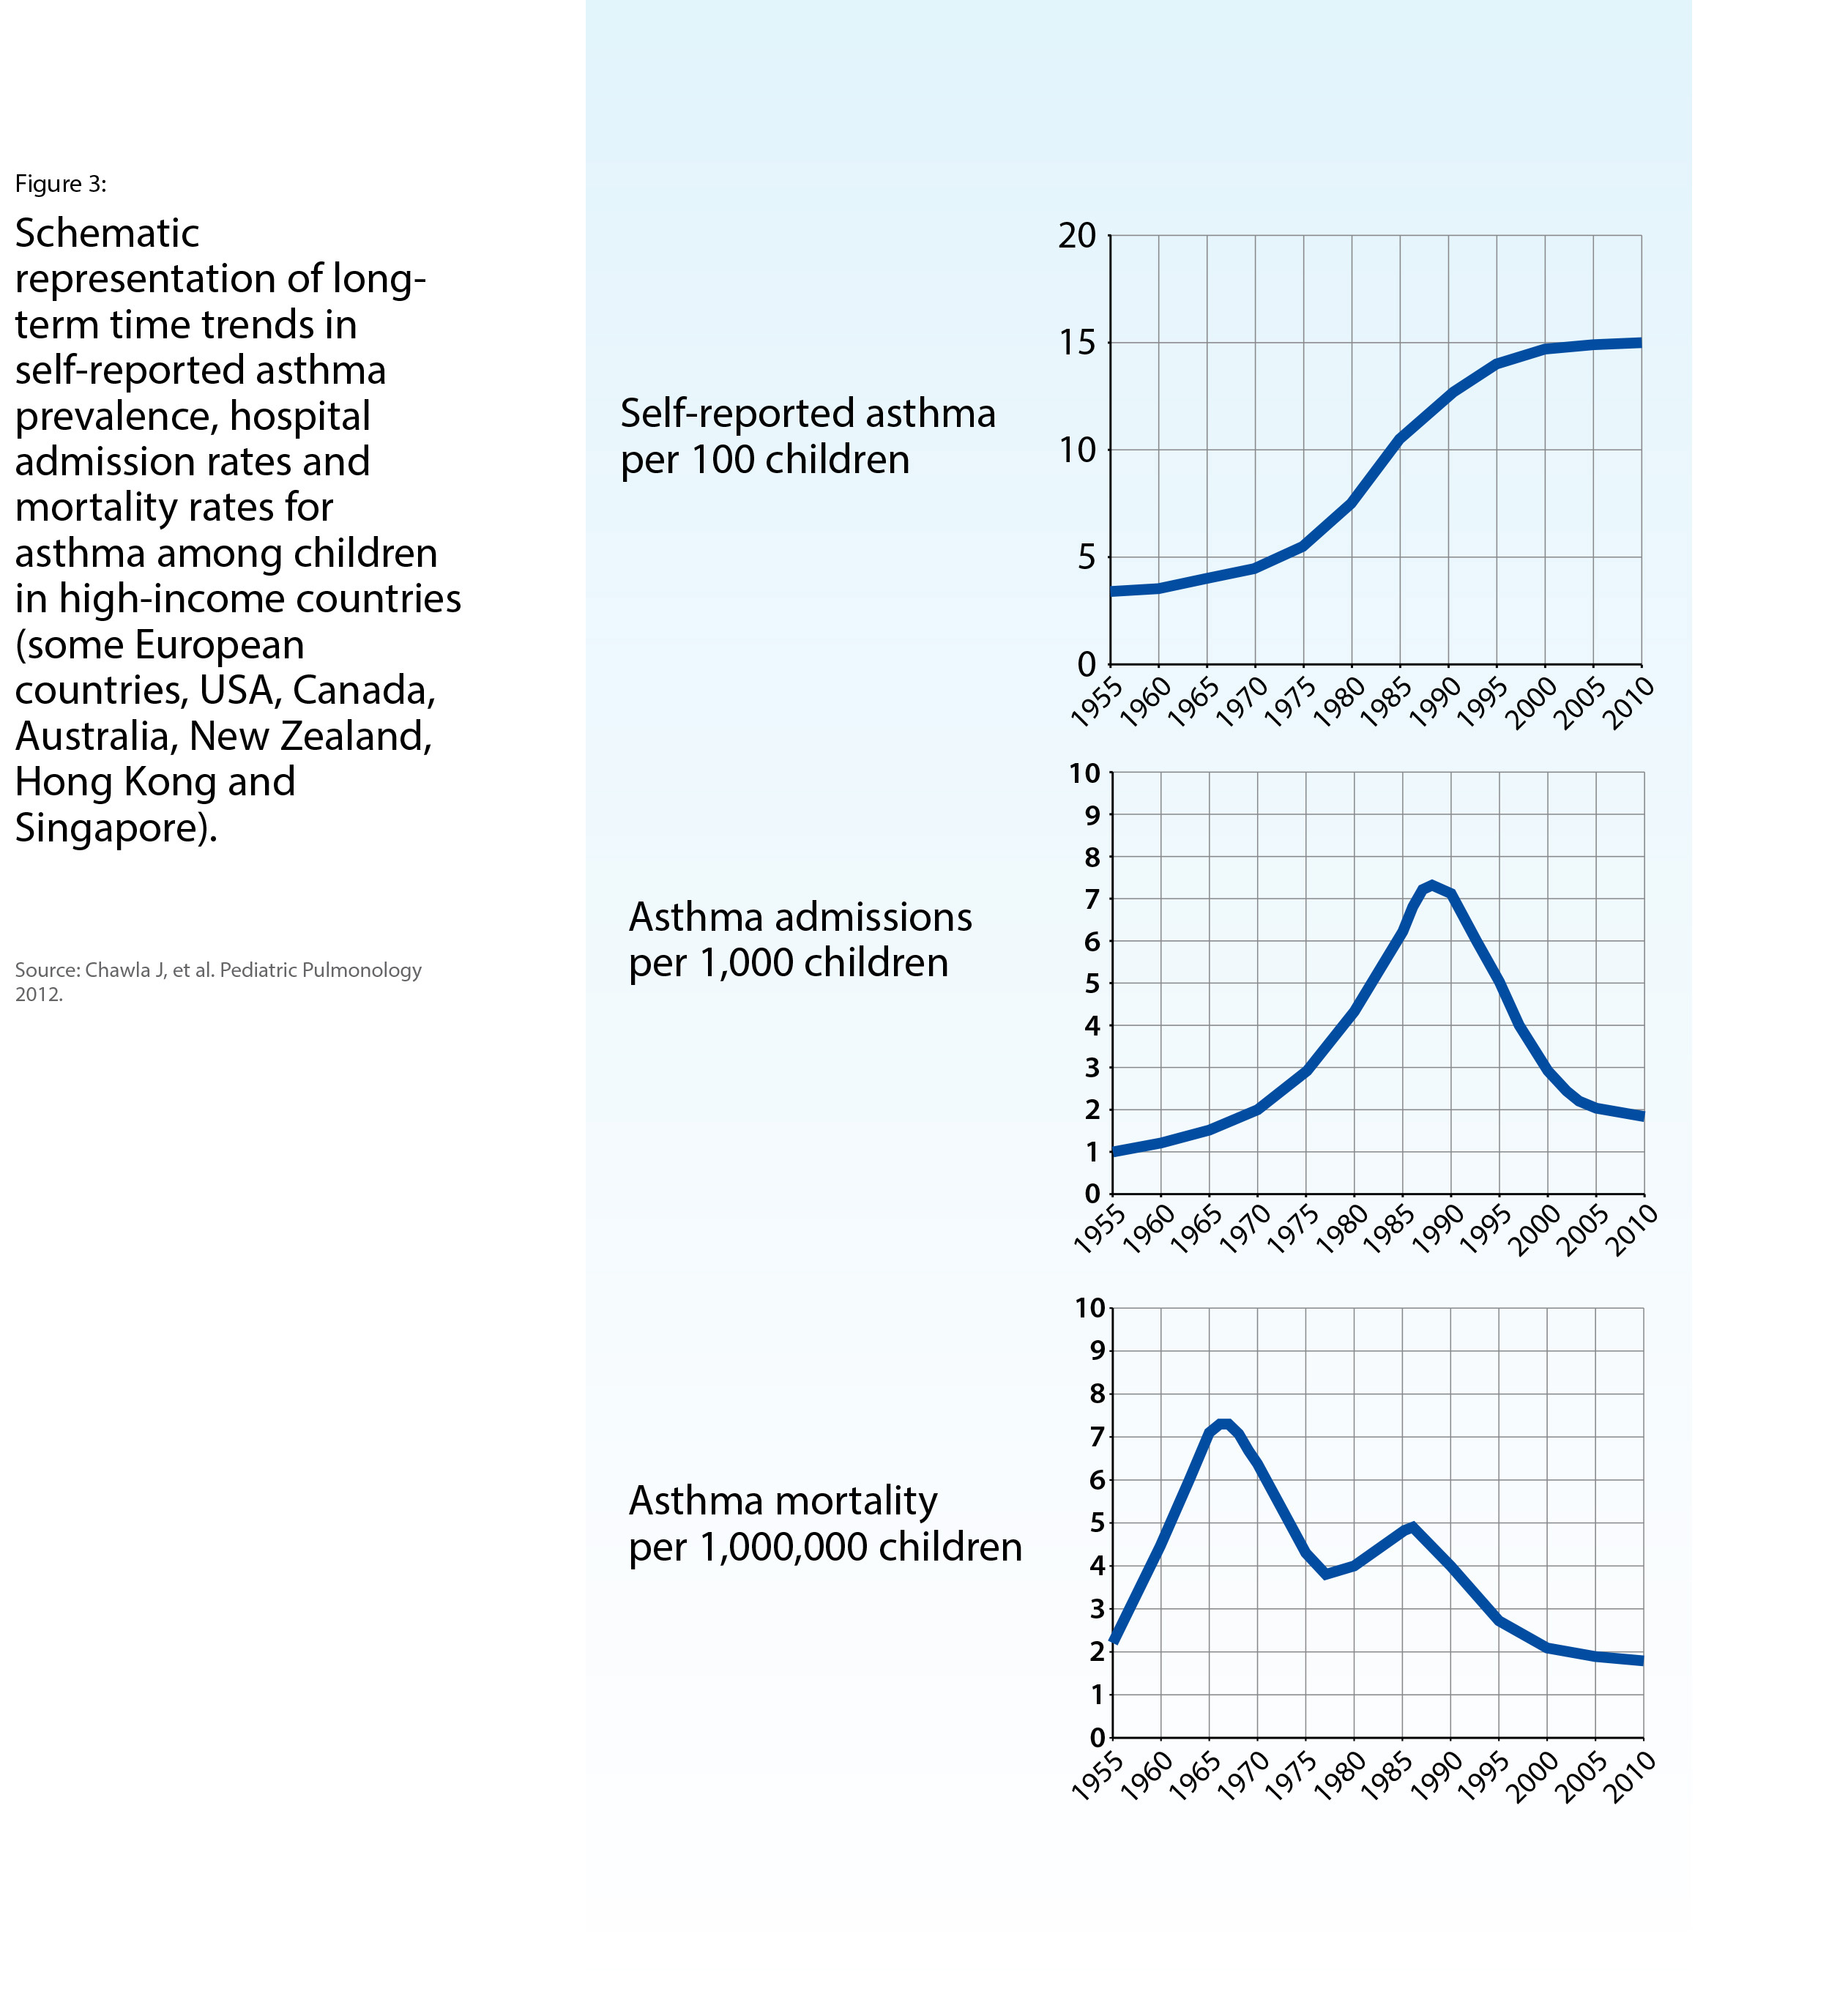
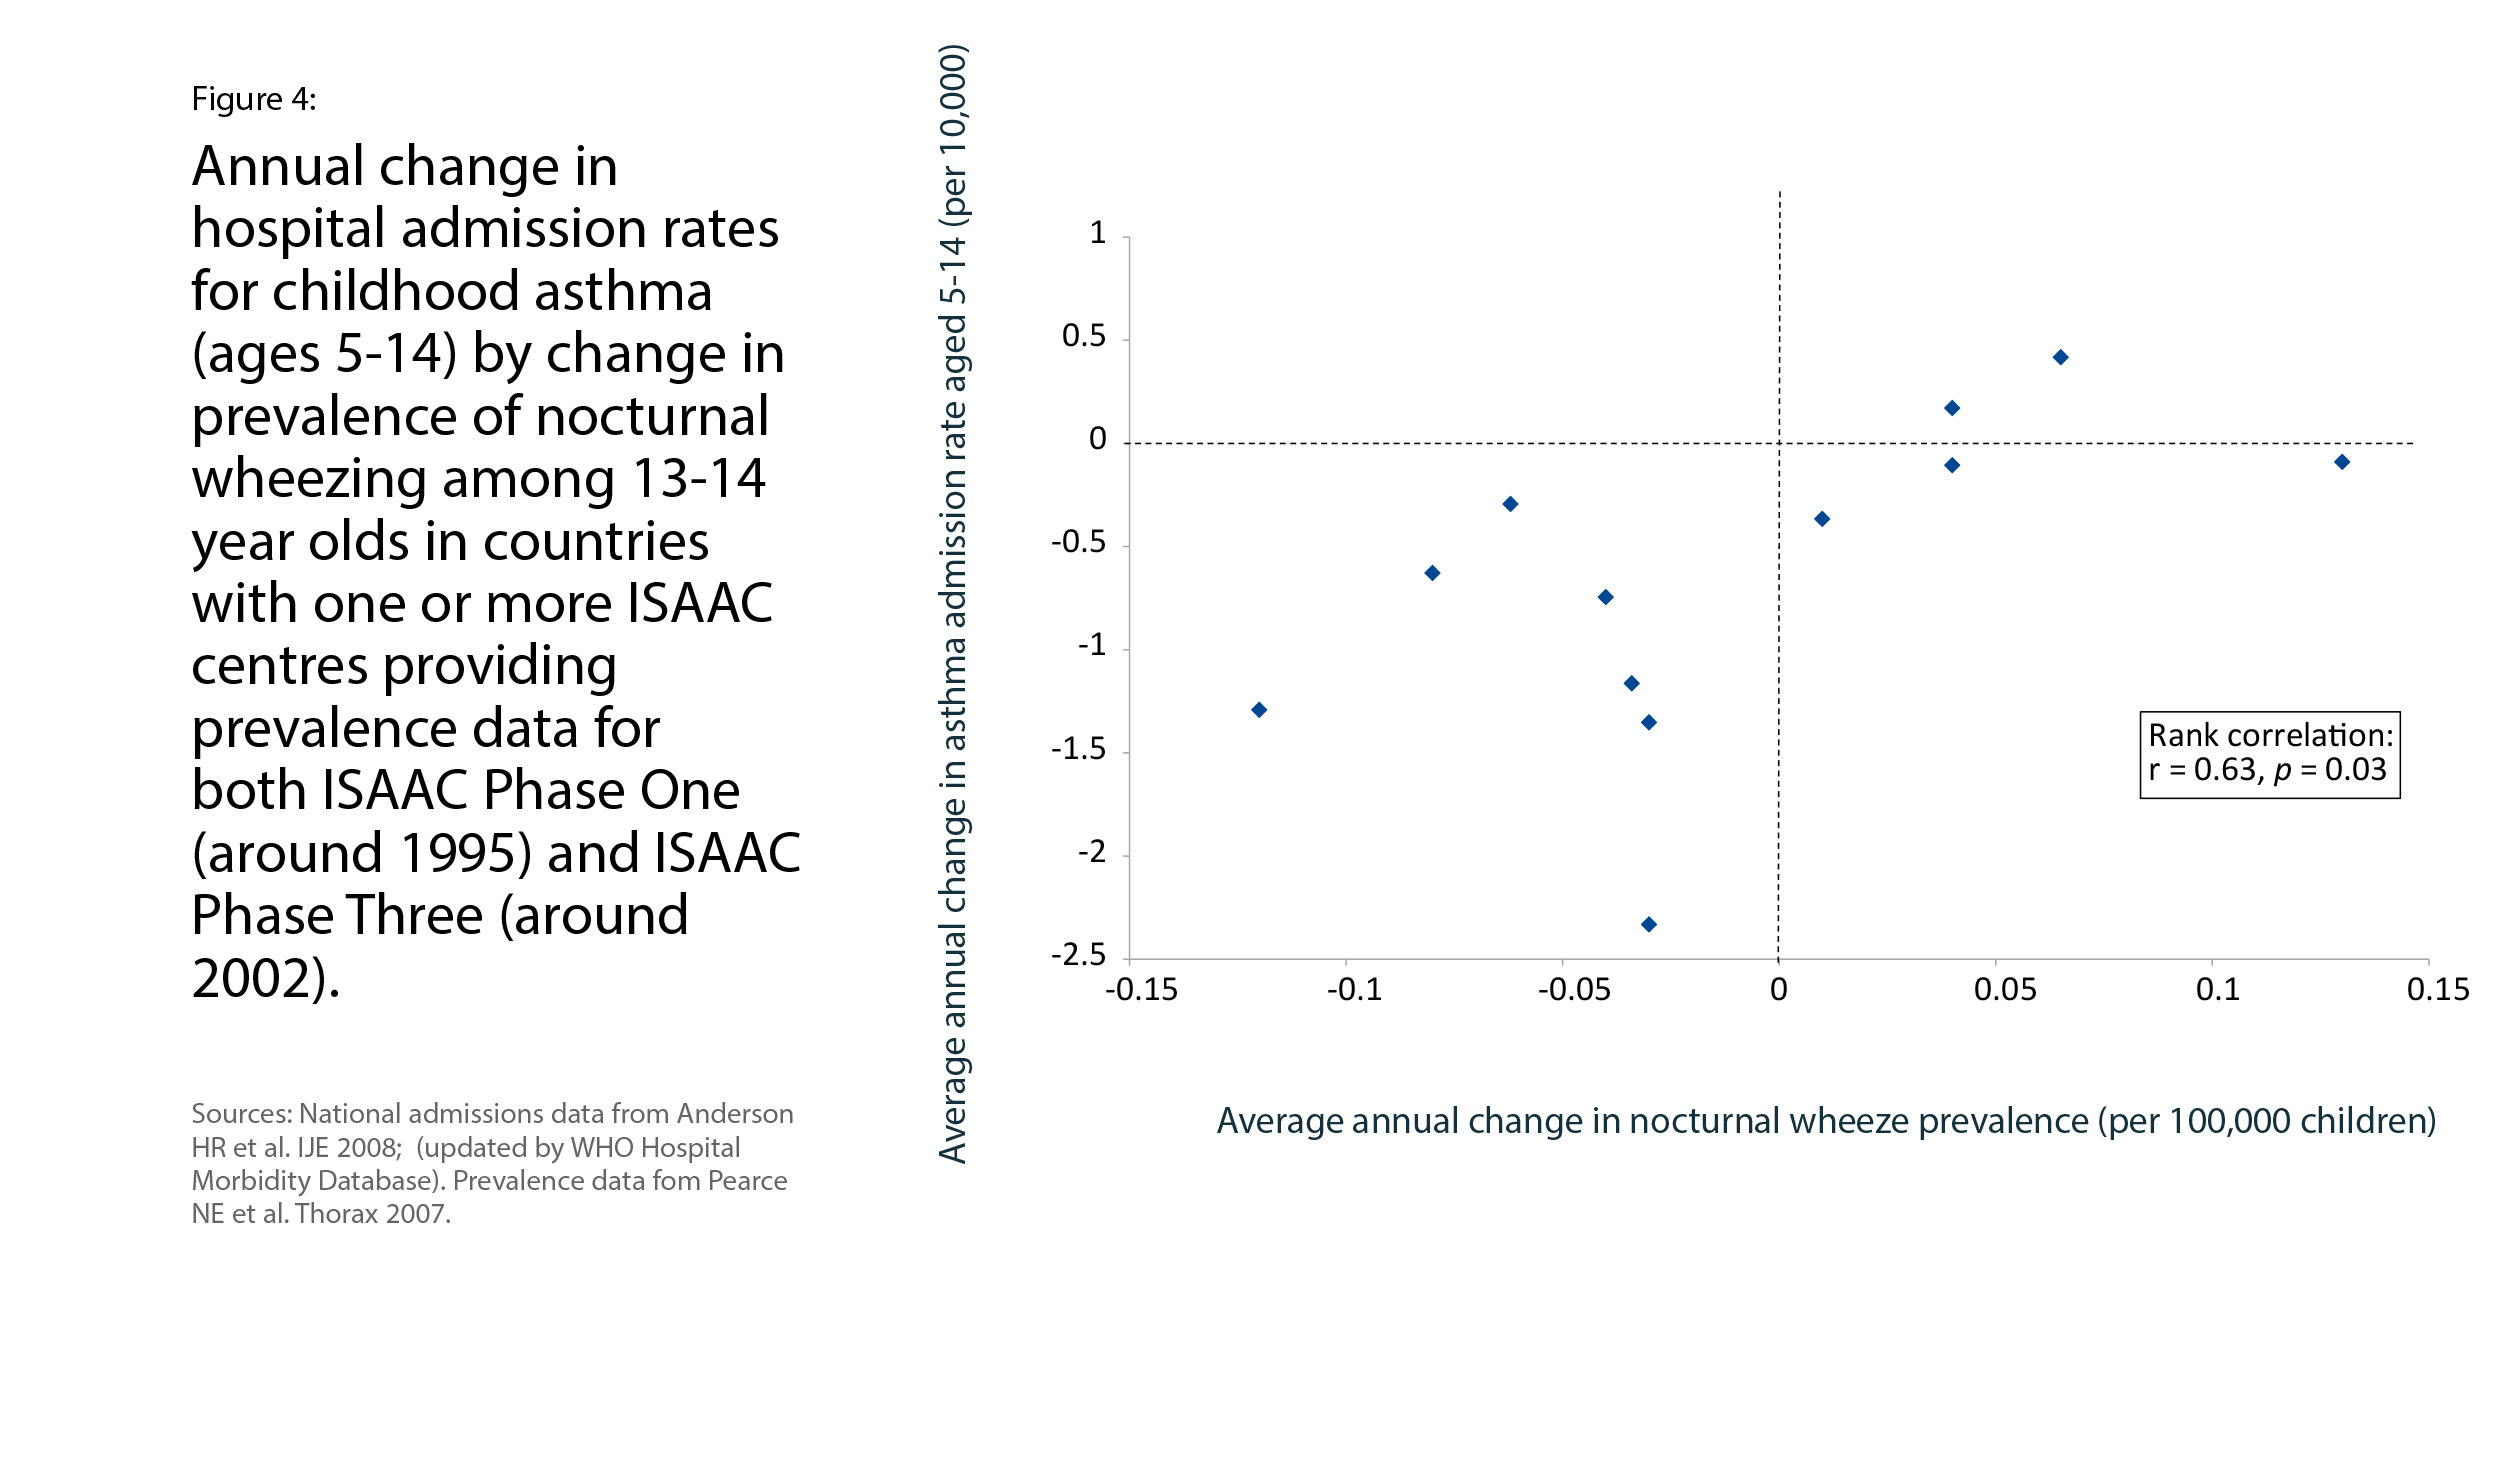
4. Hospital Admissions for Asthma
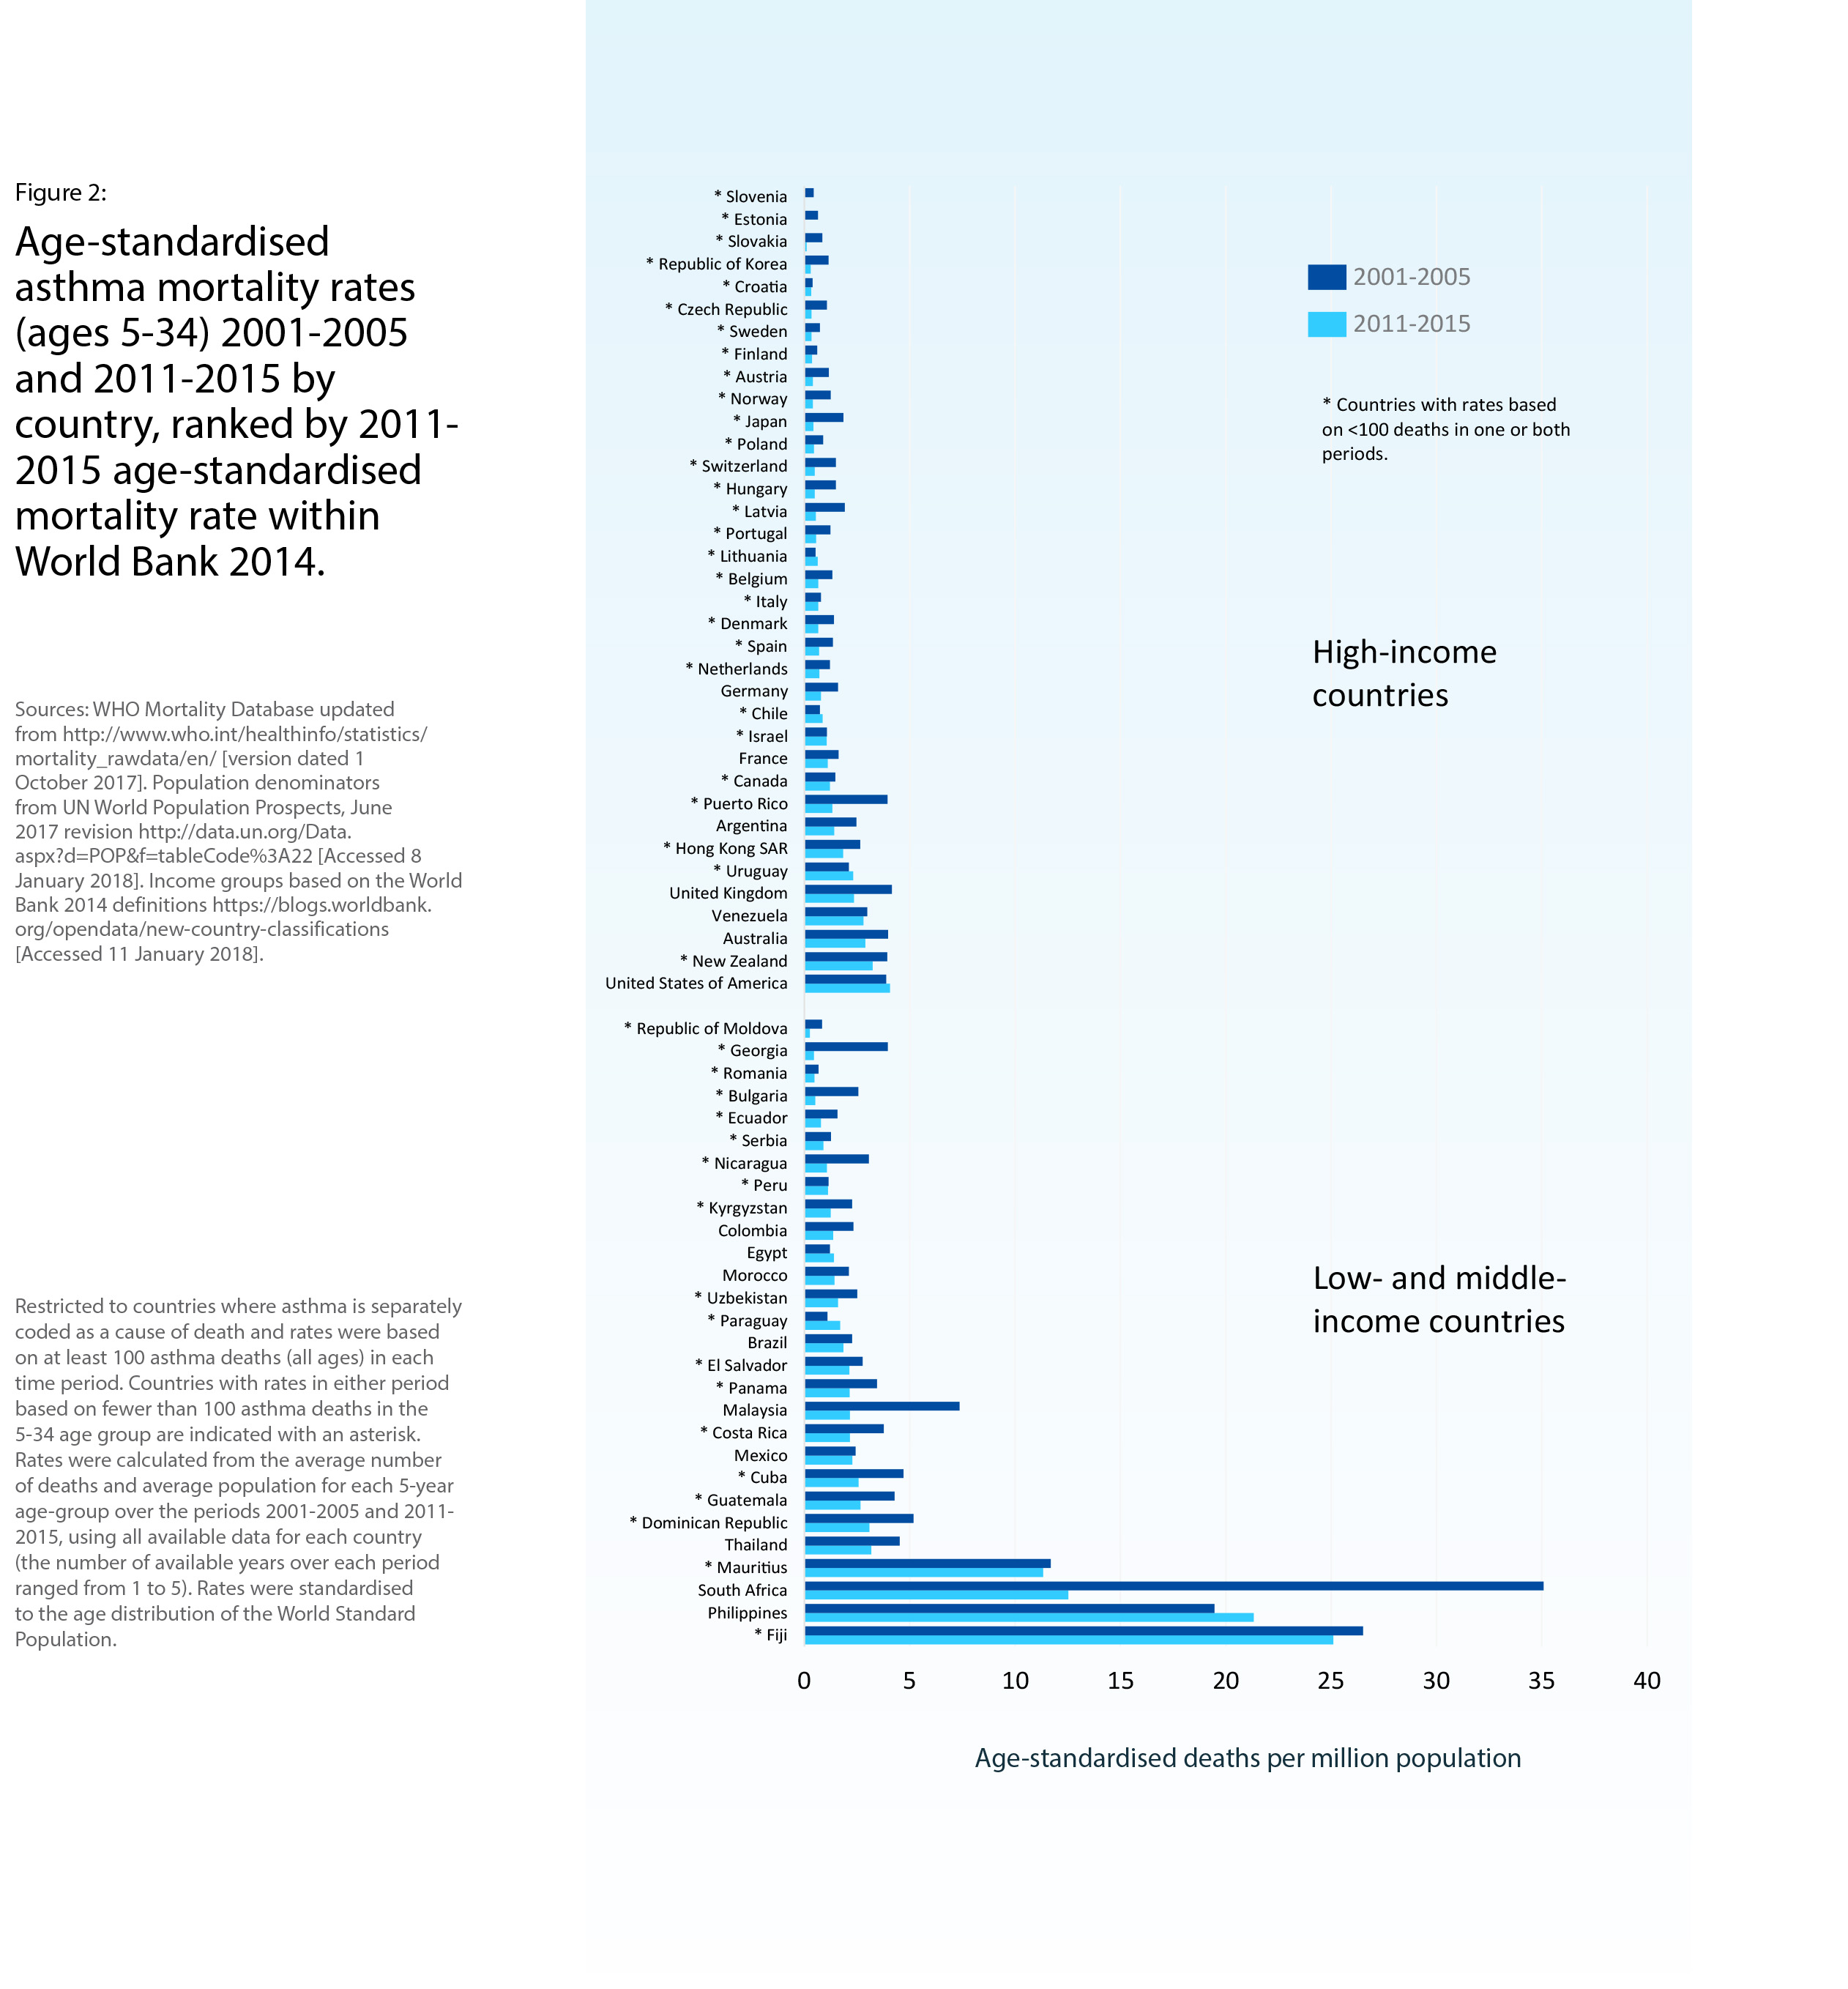
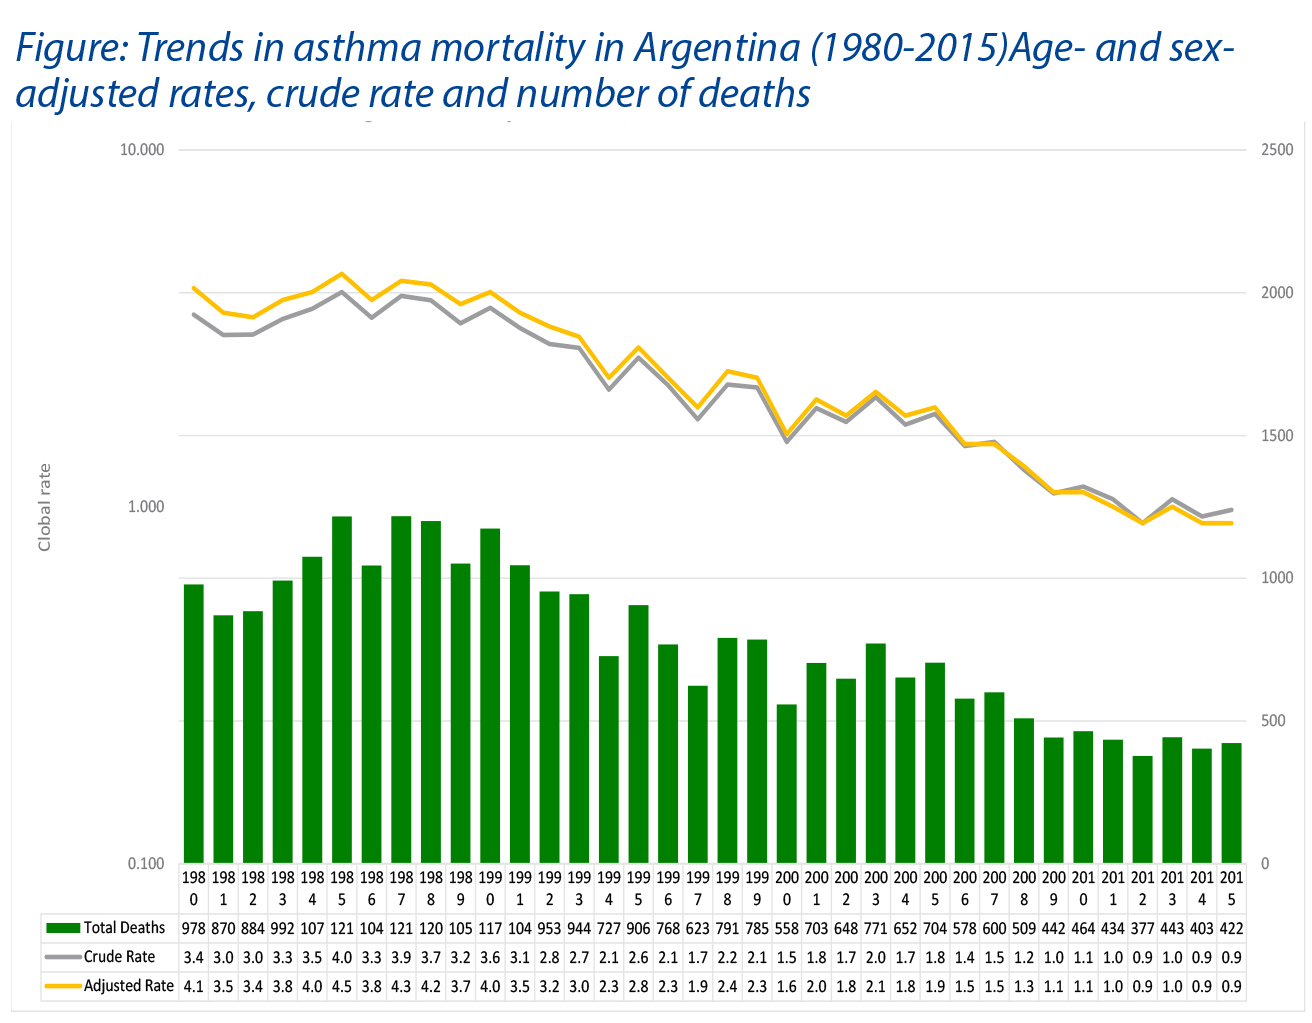
5. Asthma Mortality
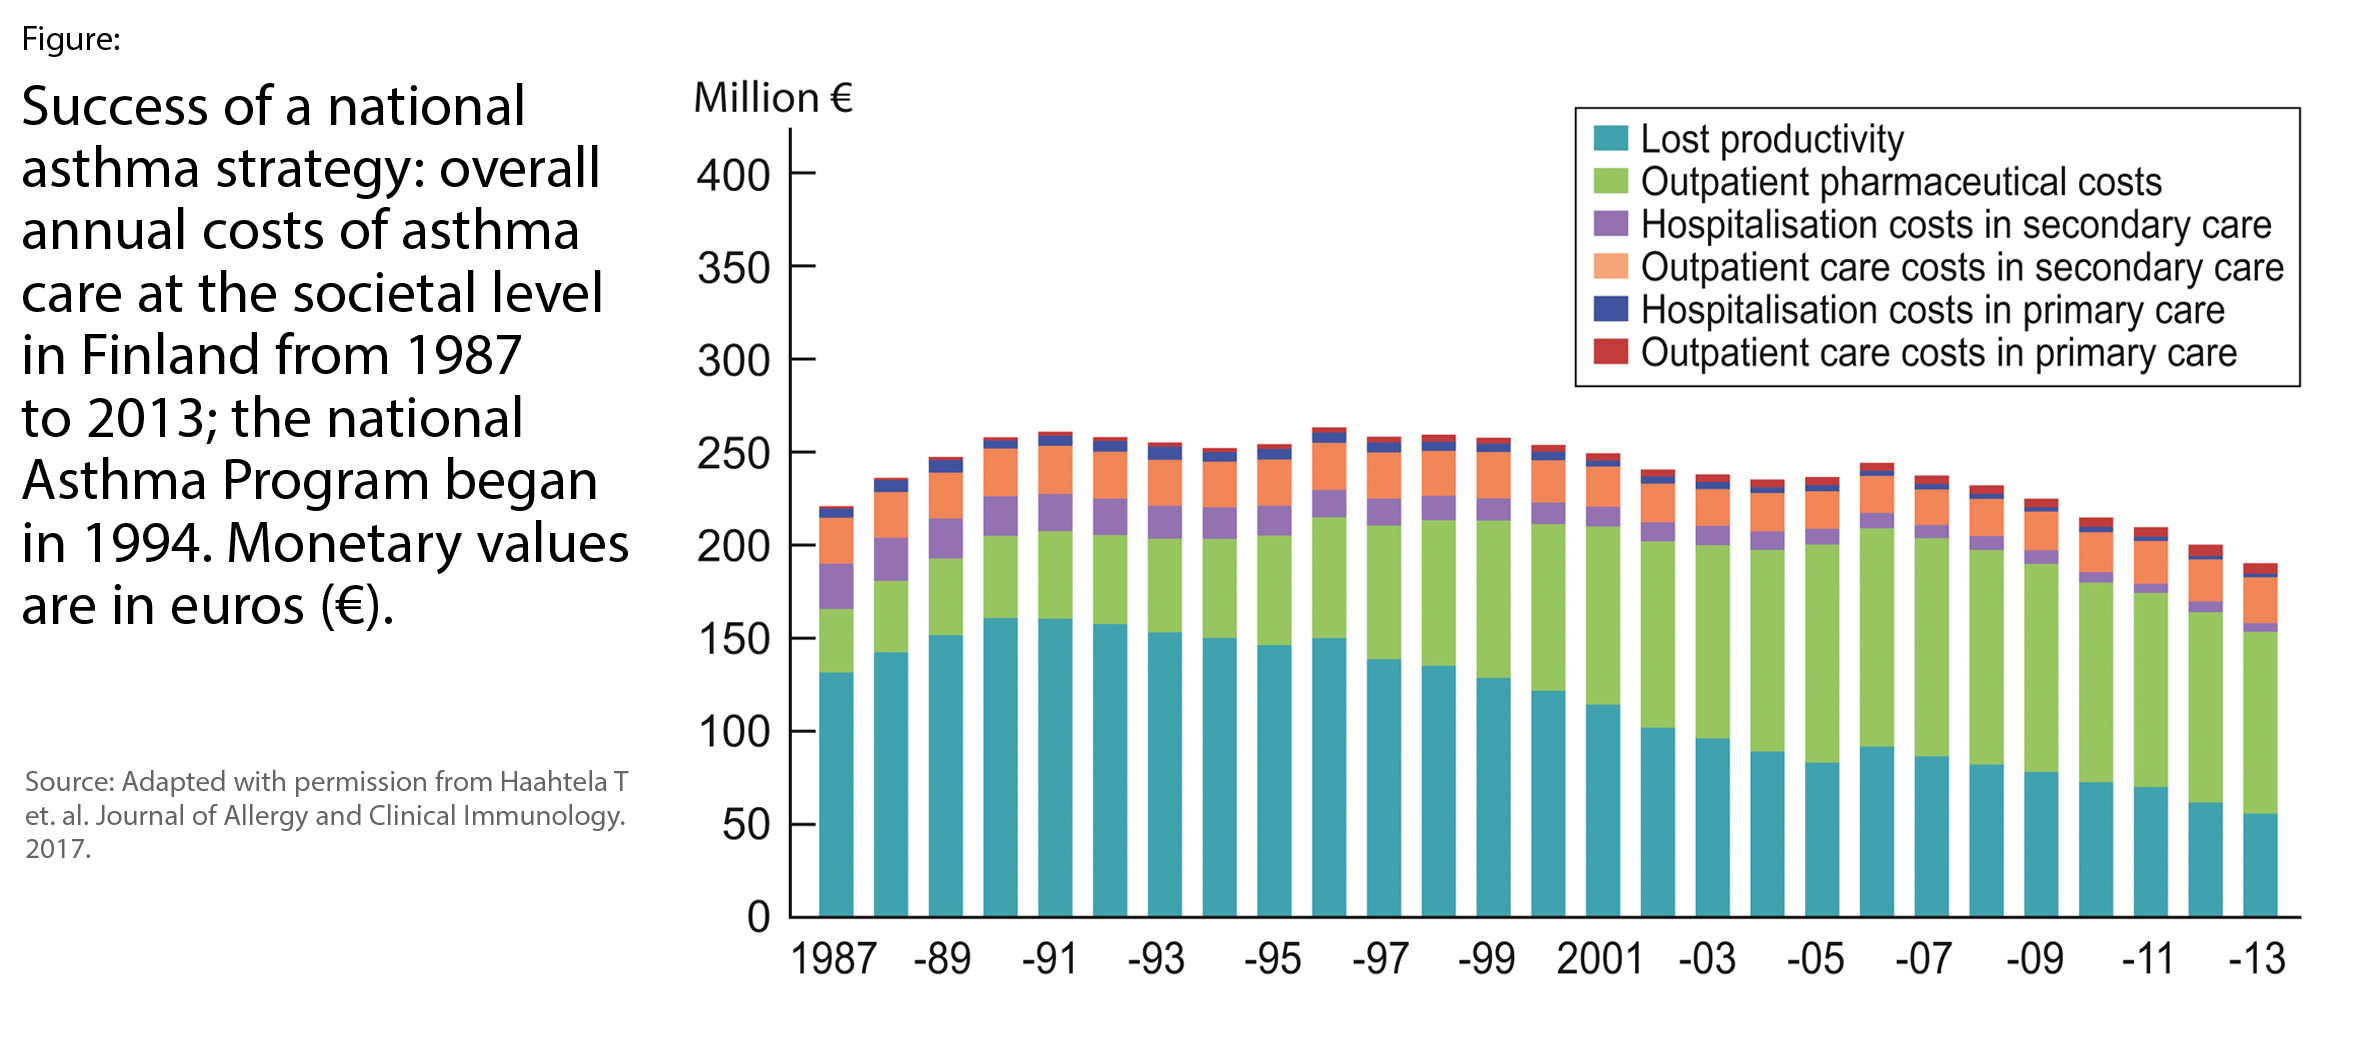
6. The Economic Burden of Asthma
7. Factors Affecting Asthma
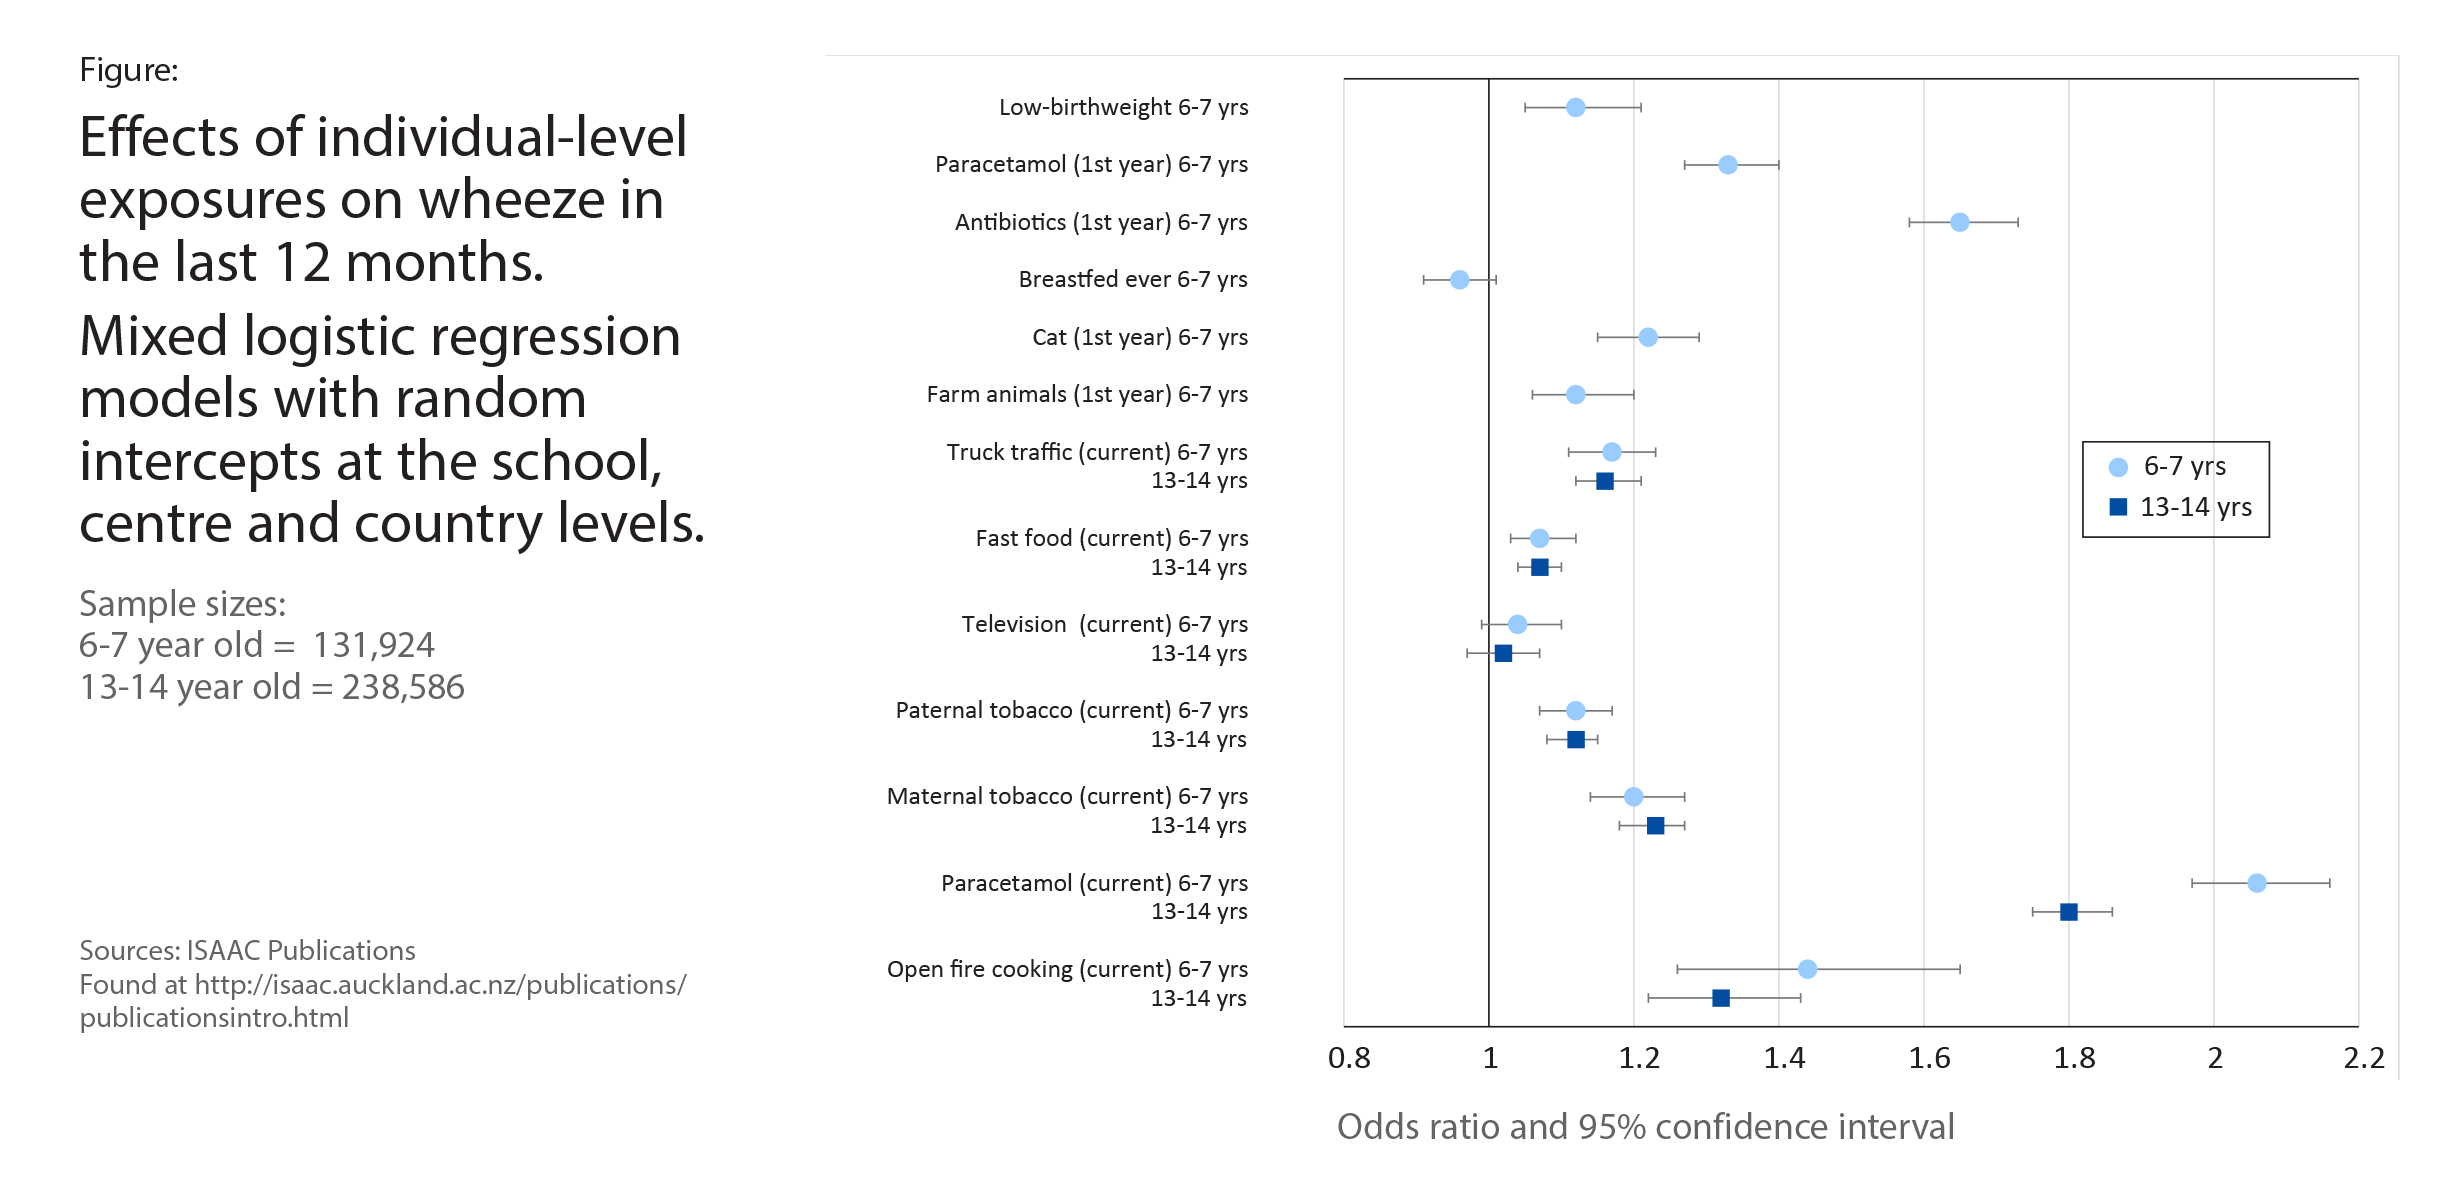
Figure. Effects of individual-level exposures on wheeze in the last 12 months Mixed logistic regression models with random intercepts at the school, centre and country levels.8. Cost-effectiveness of Asthma Management using Inhaled Corticosteroids
9. Spacers for Asthma and Wheezing in Children
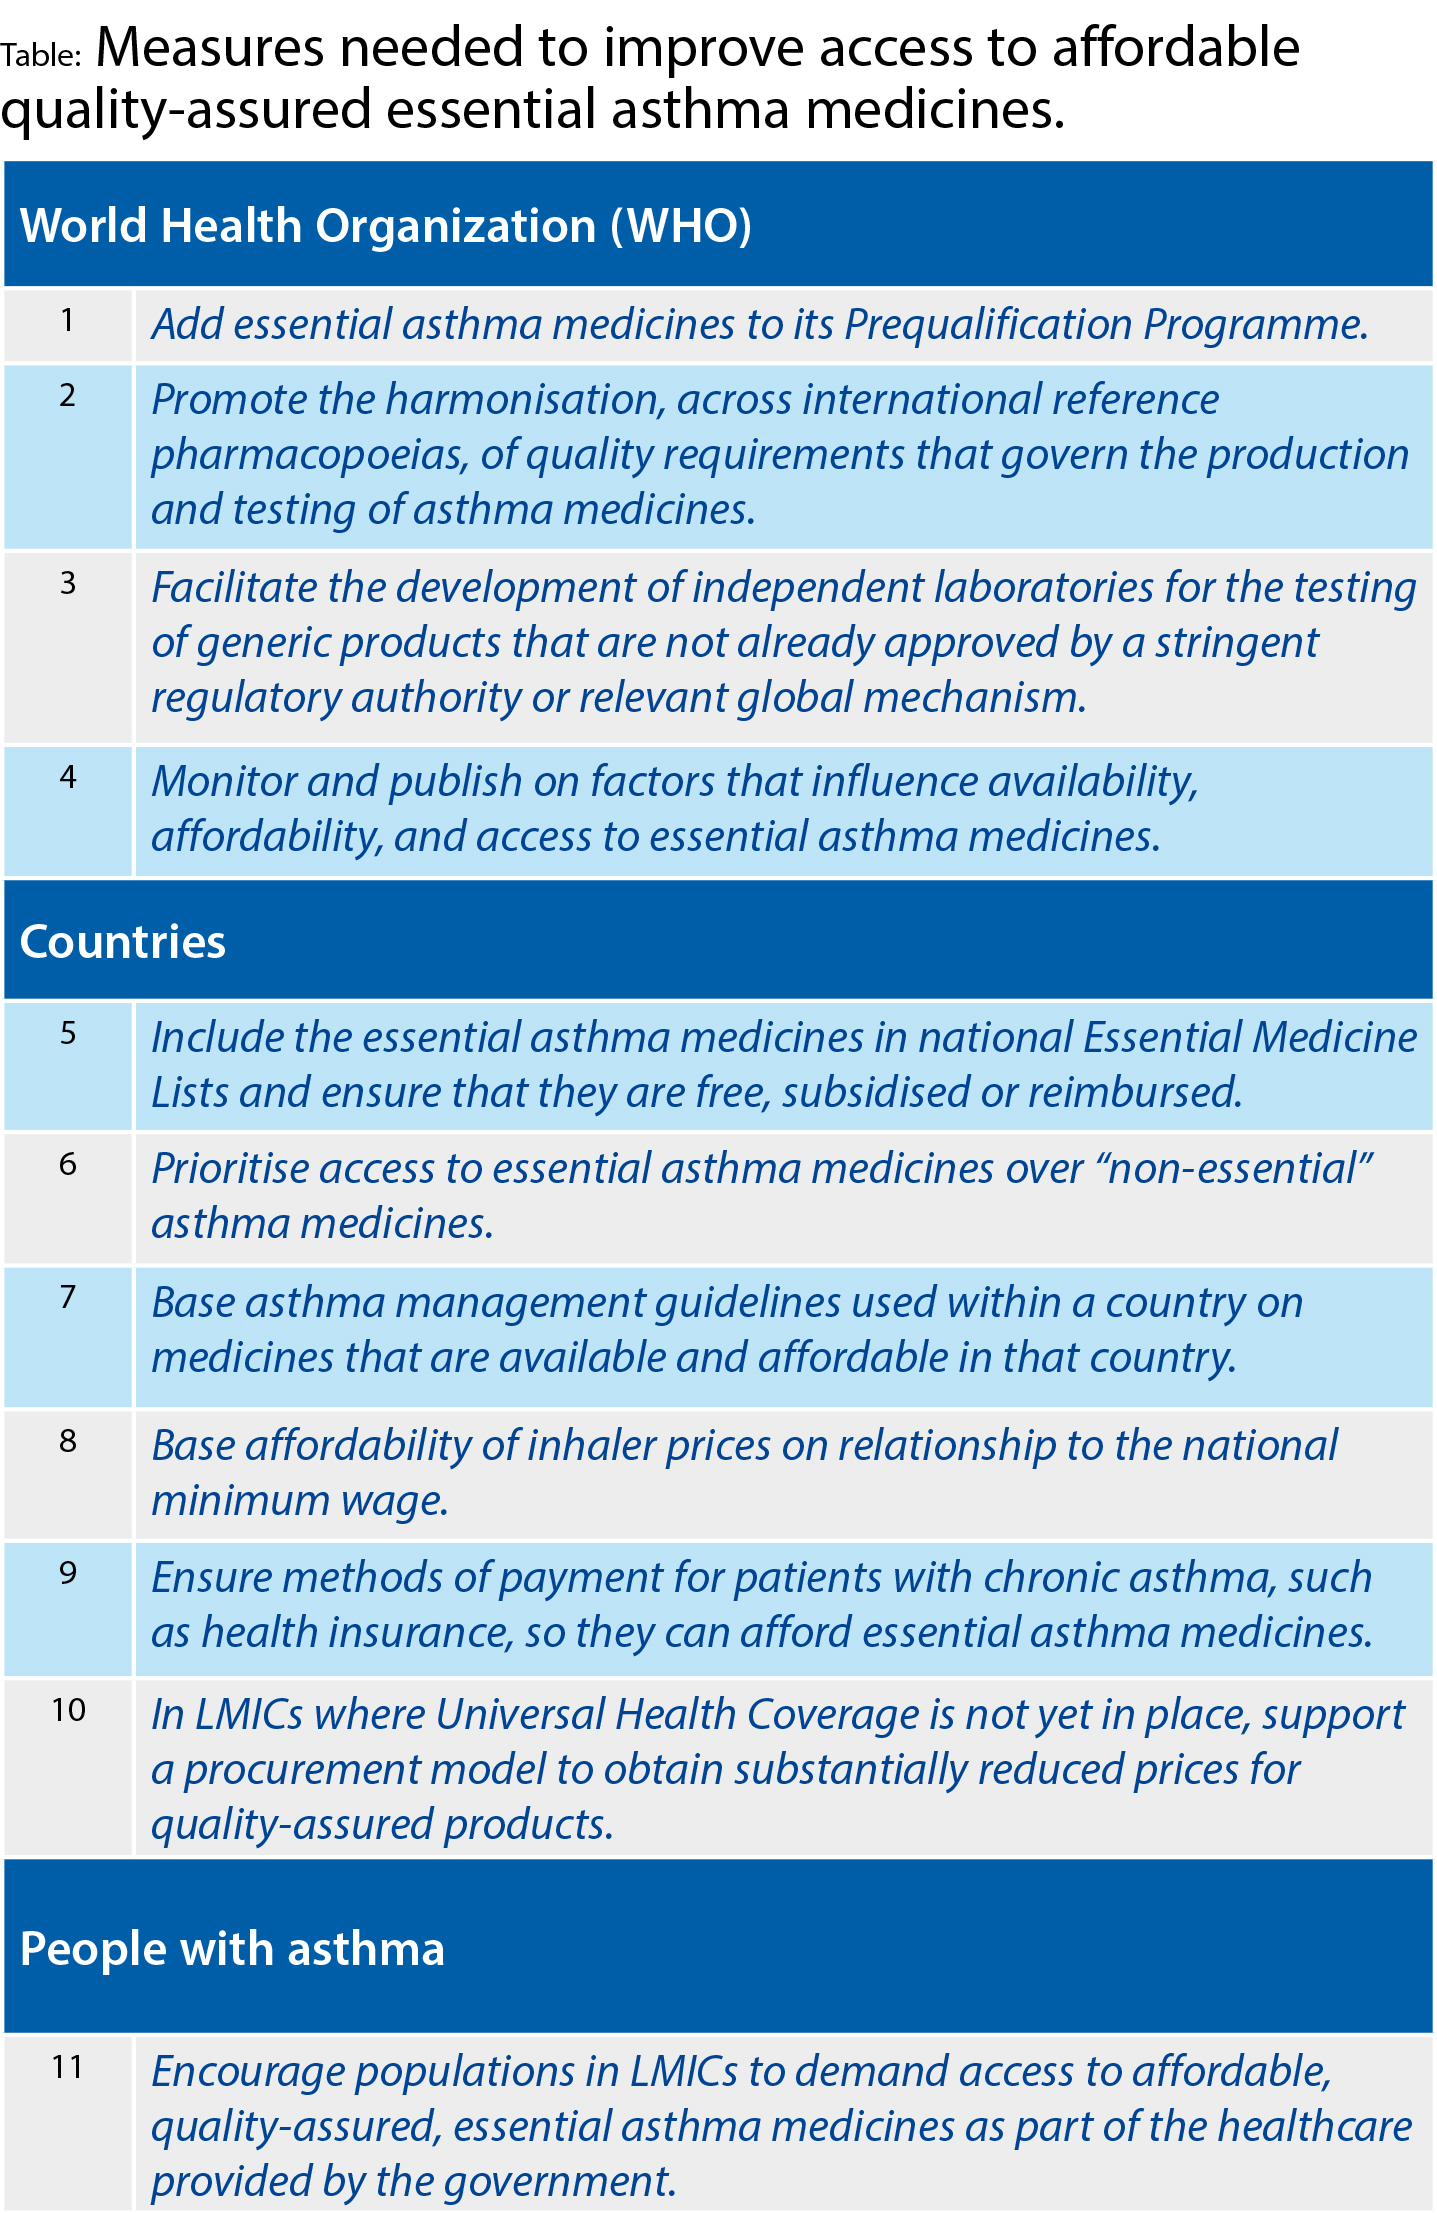
10. Achieving Access to Affordable, Quality-Assured, Essential Asthma Medicines
Table. Measures needed to improve access to affordable quality-assured essential asthma medicines.
11. Asthma Management in Low-Income Countries
Table. Standard case management: The eight components.
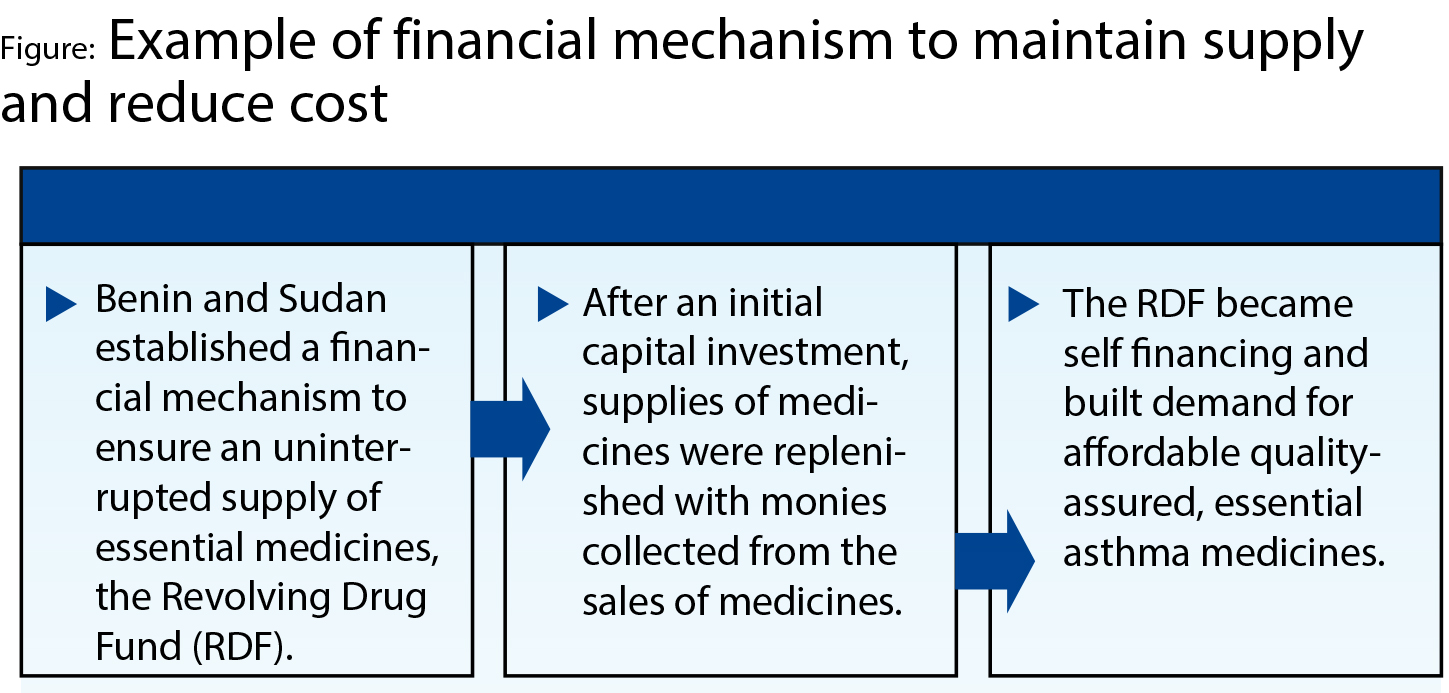
Figure. Example of financial mechanism to maintain supply and reduce cost.
12. Asthma in regions: Country reports from Africa
Benin:
Ghana:
Kenya:
Nigeria:
Figure: Cover page of the Guideline for Asthma Management in Nigeria.
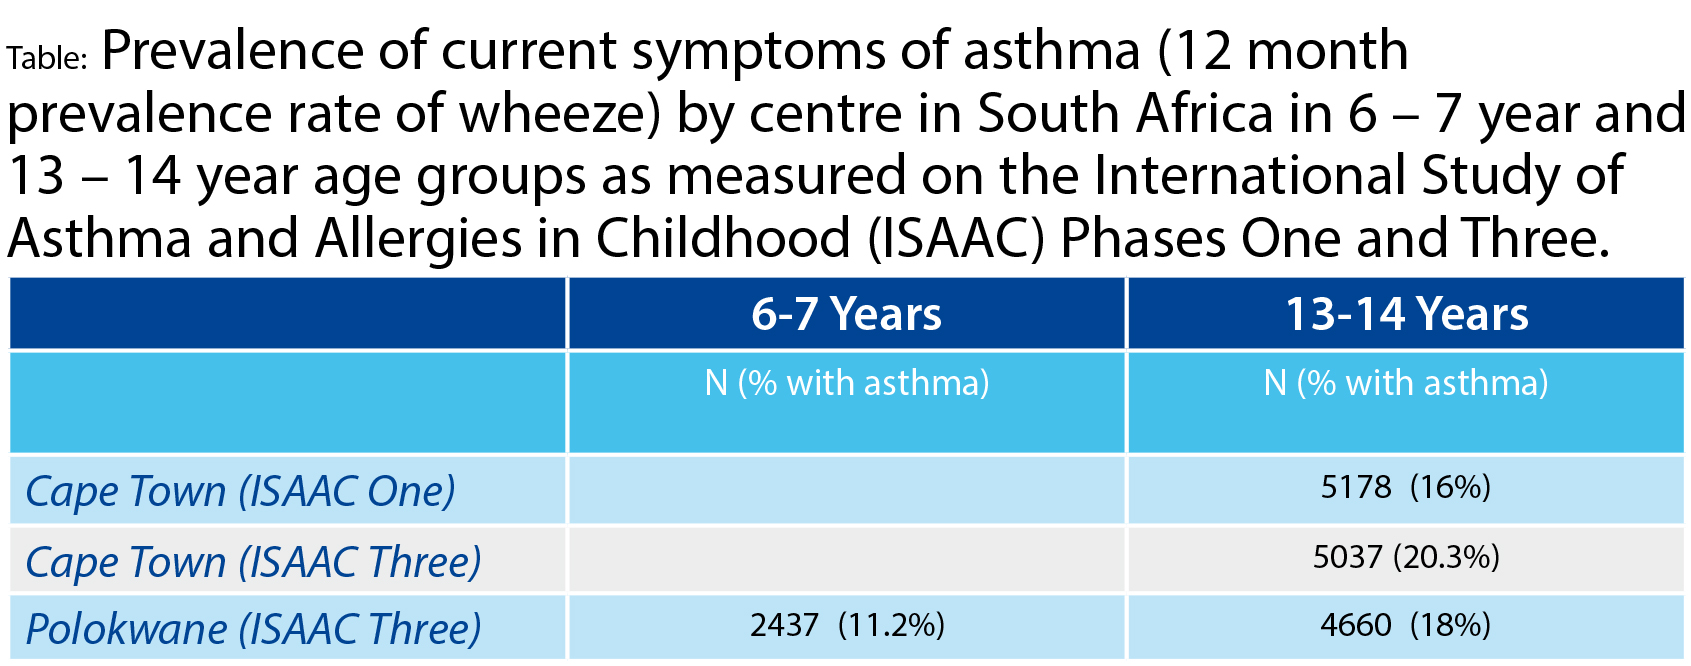
South Africa:
Sudan:
Africa-tailored spirometry training course:
13. Asthma in regions: Country reports from Asia and India
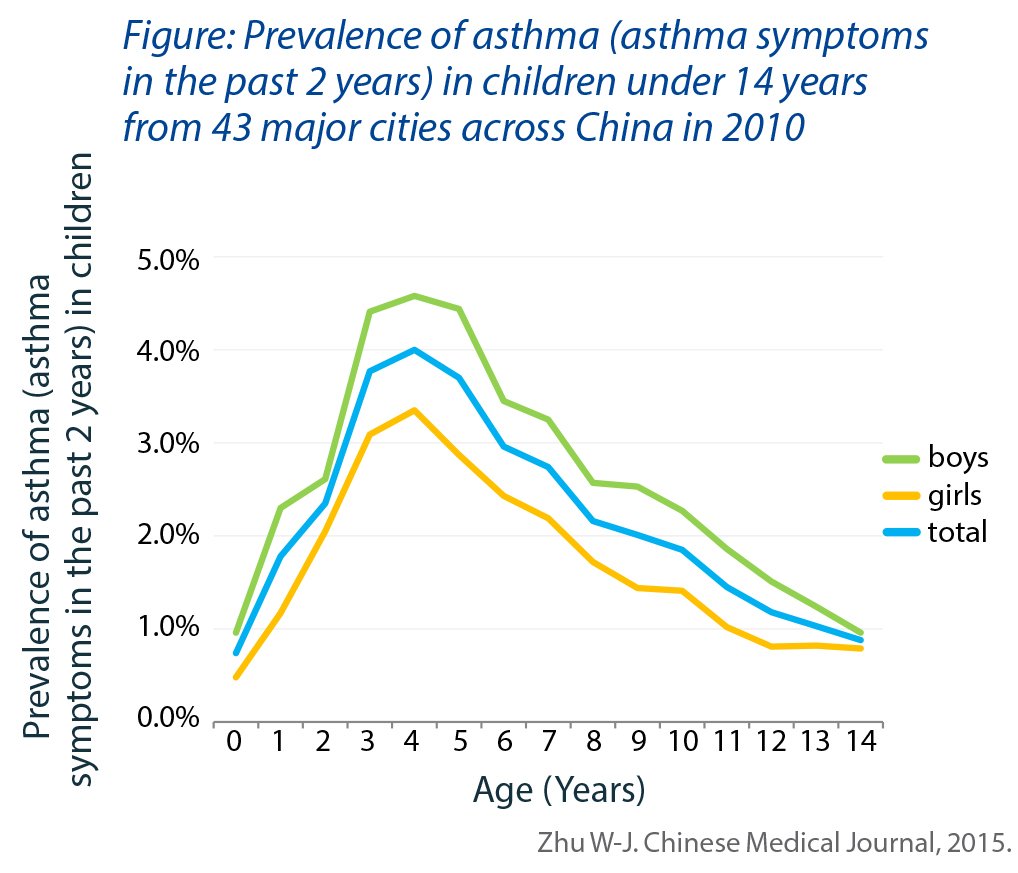
China:
India:
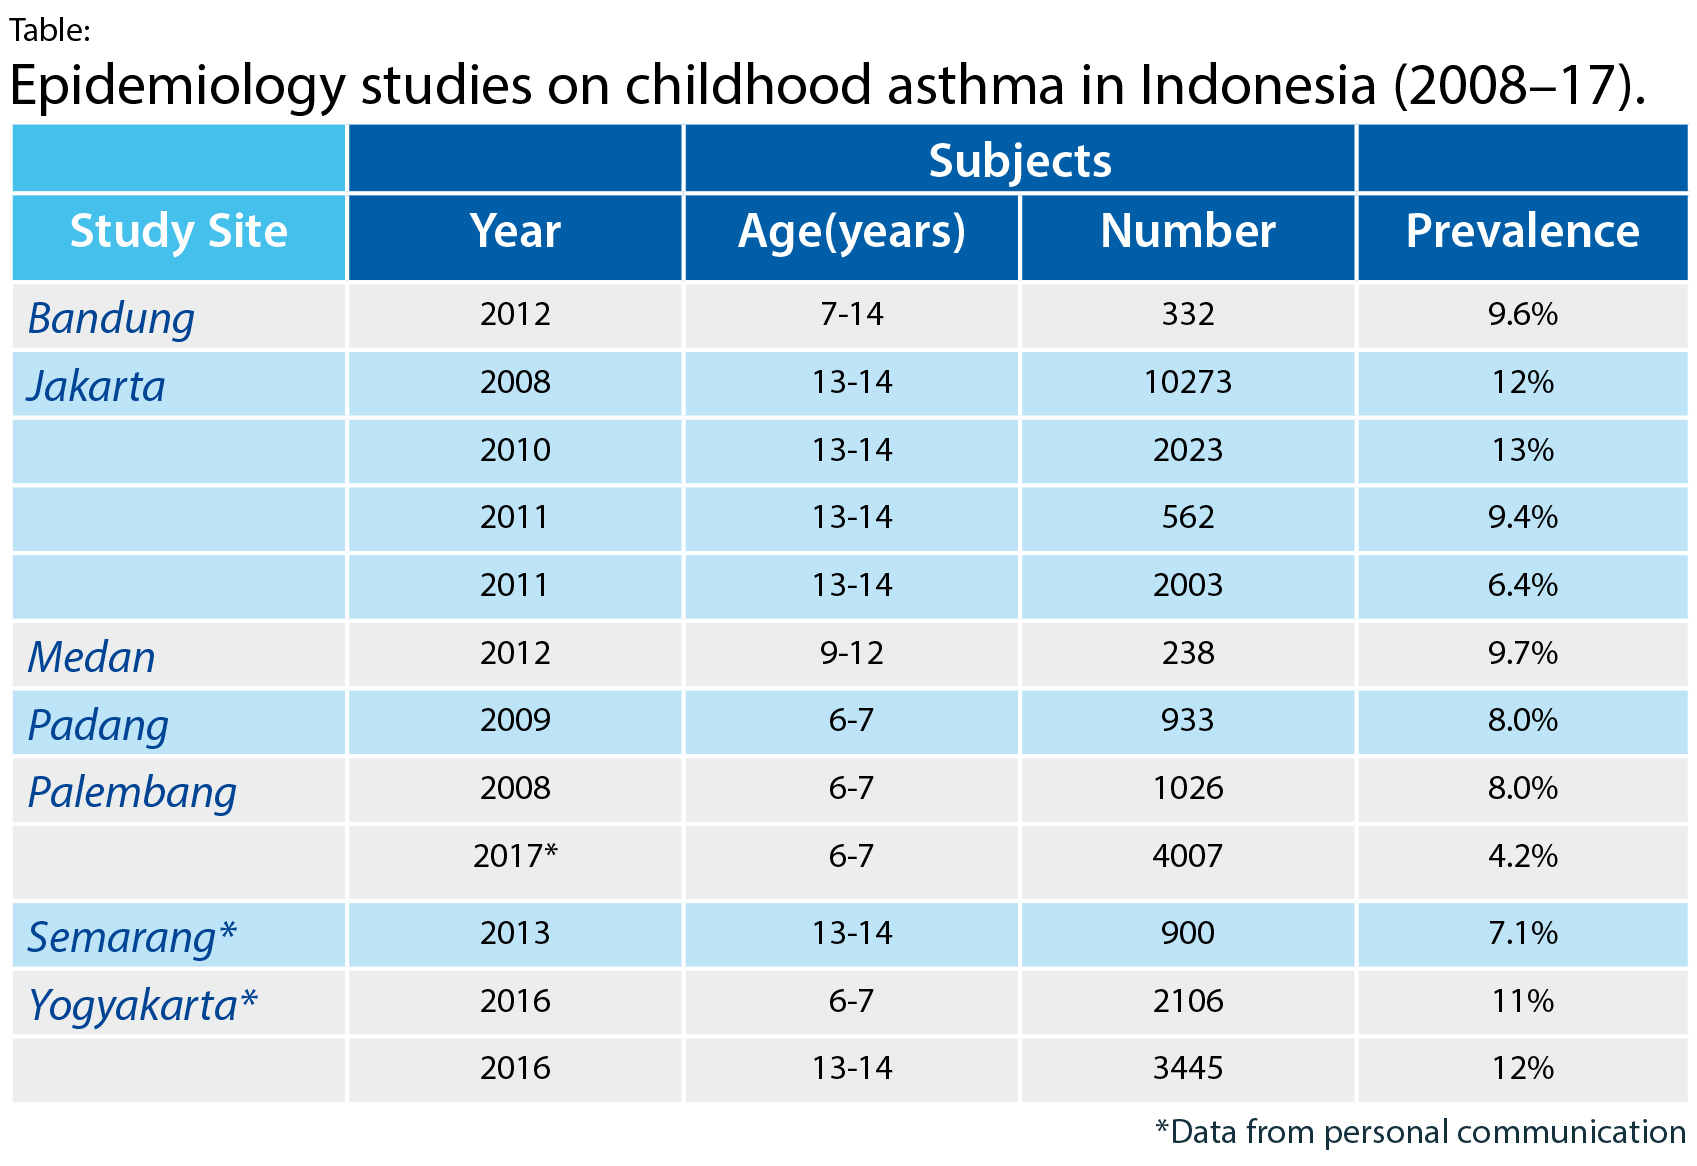
Indonesia:
Table. Epidemiology studies on childhood asthma in Indonesia (2008-17).
